
Order a report
Custom-made industry research, company ratings, competitor analysis


Trends in production, distribution and of motion pictures, video films and television broadcasts
Information agency Credinform observes tendencies in the sphere of production, distribution and release of motion pictures, video films and television broadcasts.
The companies with the highest volume of revenue (TOP-10 and TOP-3000) were selected for the ranking, according to the data from the Statistical Register for the latest available periods (2015 and 2016). Analysis was based on the data from the Information and Asnalytical system Globas.
Legal forms and unreliable data
The most widespread legal form in the industry is a Limited liability company. Significant shares make non-public joint-stock companies (Picture 1).
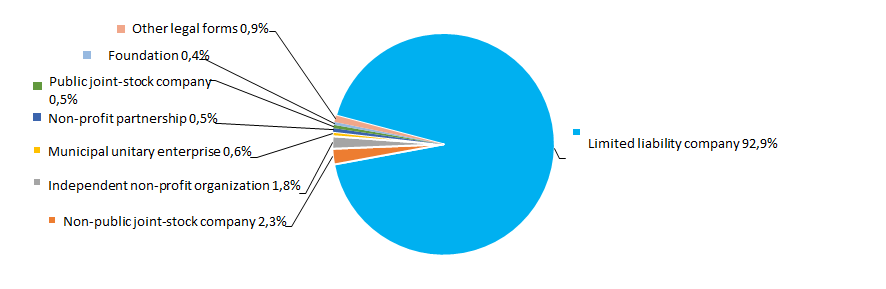 Picture 1. Distribution of TOP-3000 companies by legal forms
Following the results of the investigations of the Federal Tax Service of the RF, almost 9% of companies in the industry are entered records about unreliable data to the Unified state register of legal entities (EGRUL) (Picture 2).
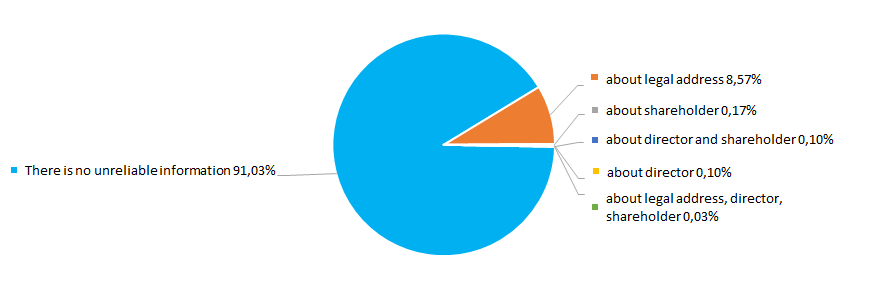 Picture 2. Shares of TOP-3000 companies, with records in the EGRUL about unreliable data
Sales revenue
Revenue of 10 leaders of the industry in 2016 was 31% from the total revenue of the 3000 largest companies. This demonstrates relatively high level of competition in the industry. The largest company in terms of revenue volume in 2016 was LLC SOLYARIS PROMO PRODUCTION – enterprise involved in filming and television content production for Russian and foreign TV channels; production and producing of feature films; entitling Russian TV channels with rights for foreign films exhibition; managing of music TV channel TNT MUSIC; developing of promising projects in the sphere of Internet and mobile technologies; launching premium-class restaurants (Picture 3).
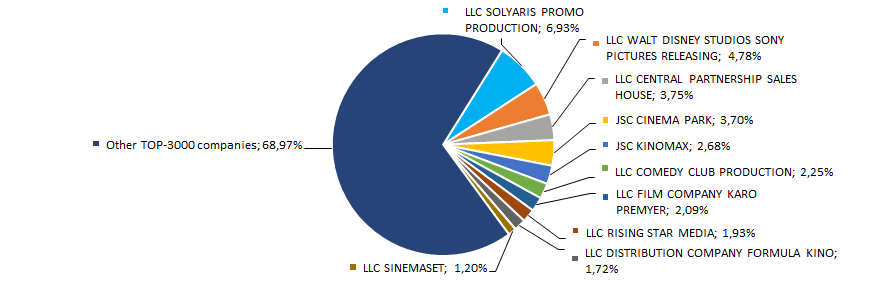 Picture 3. Shares of TOP-10 companies in the total revenue of 2016 of TOP-3000
The best results in the industry in terms of revenue volume for a ten-year period were reached in 2011. During crisis periods in the economy in 2012, 2013 and 2015 average industrial values have decreased. In general, the tendency for increasing of revenue volume is observed (Picture 4).
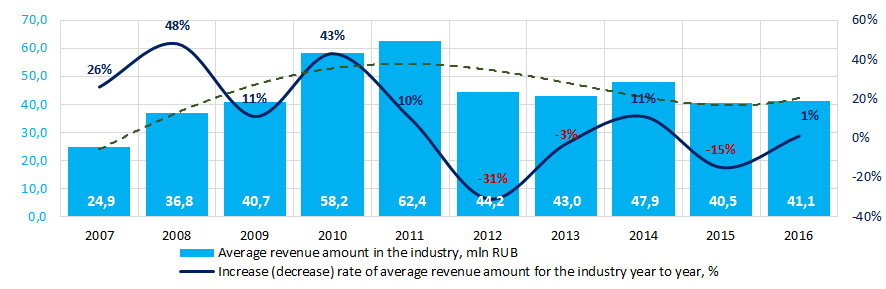 Picture 4. Change in average industrial values of revenue in the sphere of film making companies in 2007 – 2016
Profit and loss
Profit volume of 10 leaders of the industry in 2016 was 32% of the total profit of TOP-3000 companies. LLC CENTRAL PARTNERSHIP SALES HOUSE takes lead in 2016 in terms of profit volume – one of the largest television and film distributors in Russia (Picture 5).
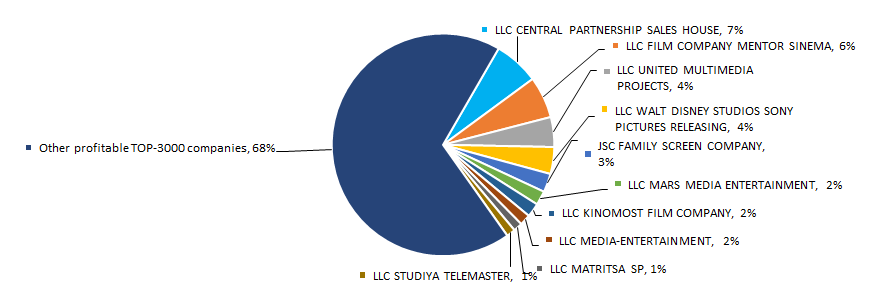 Picture 5. Shares of TOP-10 companies in the total profit volume of TOP-3000 companies in 2016
Average industrial values of the companies` profit indicators for ten years are not stable. Negative values of the indicator were observed in 2008 – 2009 and 2015. In general, profit indicators have increasing tendency. The best results in the industry were shown in 2014 (Picture 6).
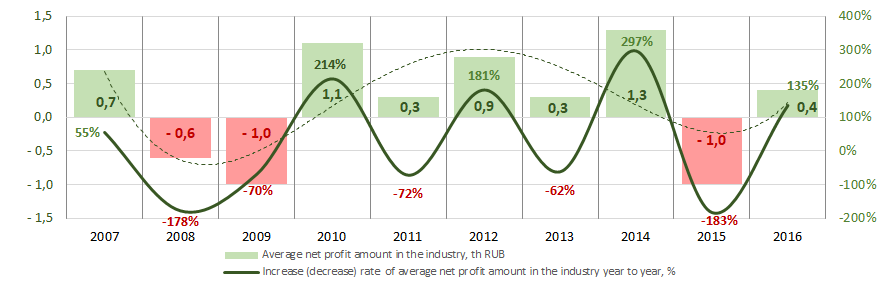 Picture 6. Change of the average industrial indicators of profit for film making companies in 2007 – 2016
Among the TOP-3000 group 896 loss-making companies or 30% were observed in 2015. The amount increased to 837 companies or by 28% in 2016. Besides, average amount of loss has 13% increased. For the rest of TOP-300 companies, average amount of profit has 14% decreased for the same period (Picture 7).
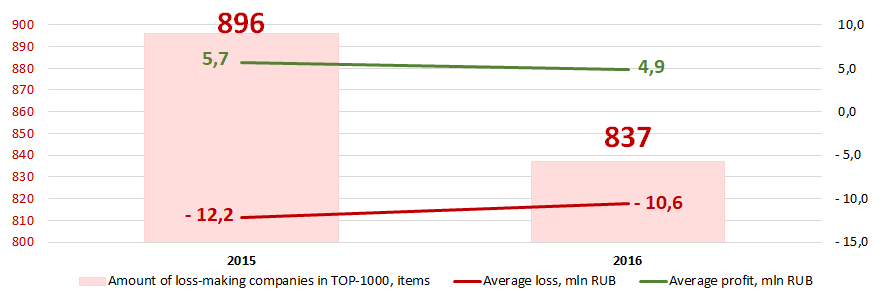 Picture 7. Amount of loss-making companies, average values of loss and profit for TOP-3000 companies in 2015 – 2016
Key financial ratios
For ten years average indicators of current liquidity ratio in the industry were below the interval of the recommended values – from 1,0 to 2,0 and higher, except for 2008 (Picture 8).
In general, indicator of the ratio has decreasing tendency.
Current liquidity ratio (the relation of the amount of current assets to short-term liabilities) shows the sufficiency of company’s funds for repayment of its short-term liabilities.
Solvency ratio (equity to balance sheet amount) shows the dependence of the company on external loans. The recommended value: >0,5. A value less than a minimum one indicates high dependence on external sources of funds.
A calculation of practical values of financial ratios, which might be considered as normal for a certain industry, has been developed and implemented in the Information and Analytical system Globas by the experts of Information Agency Credinform, having taken into account the current situation in the economy as a whole and in the industries. For shipbuilding industry practical value of the solvency ratio is from 0,02 to 0,85 in 2016.
For a ten-year period average indicators of the ratio were lower than recommended values for eight years and in the interval of practical values for the whole period (Picture 8).
In the whole, indicator of the ratio has decreasing tendency.
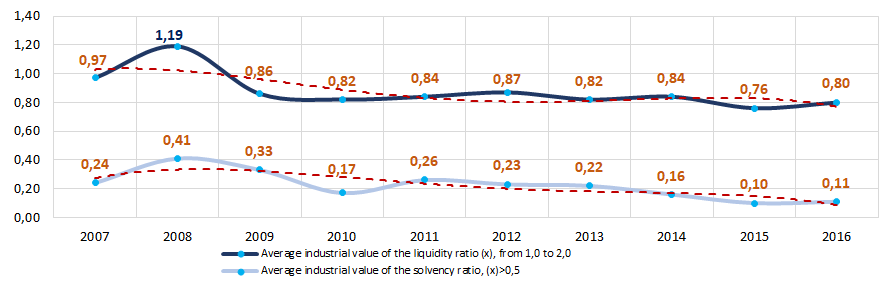 Picture 8. Change of average industrial values of the current liquidity and solvency ratios for film-making companies in 2007 – 2016
During ten years unstable indicators of the return on investments ratio with decreasing tendency were observed. In 2008 – 2009 and 2015 indicators decreased to negative values (Picture 9). The ratio is net profit to the total equity and long-term liabilities and demonstrates profit from the equity involved into commercial activities and long-term external funds of the company.
Indicators of the product (service) profitability ratio were relatively stable with decreasing tendency (Picture 9).
The ratio is sales revenue to expenses from ordinary activities. Totally, profitability indicates the economic efficiency of production.
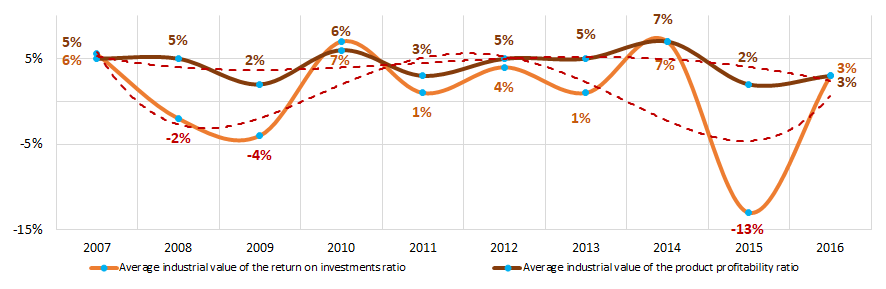 Picture 9. Change of average industrial values of the return on investments and the product profitability ratios for film-making companies in 2007 – 2016
The assets turnover ratio is sales revenue to average total assets for a period and characterizes the effectiveness of using of all available resources, regardless the source of their attraction. The ratio shows how many times per year the full cycle of production and circulation is performed, generating profit.
The equity turnover ratio is calculated as a ratio of revenue to yearly average sum of equity and demonstrates the company’s usage rate of total assets.
For ten years both ratios of business activity demonstrated increasing tendency (Picture 10).
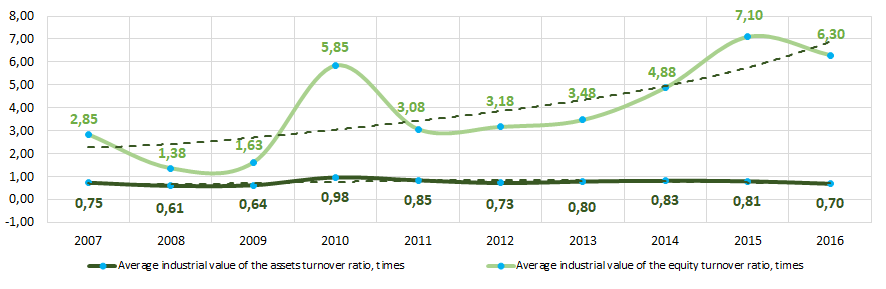 Picture 10. Change of average industrial values of the business activity ratios for film making companies in 2007 – 2016
Production and services structure
Major part of TOP-3000 companies specializes in production of motion pictures, video films and television broadcasts (Picture 11).
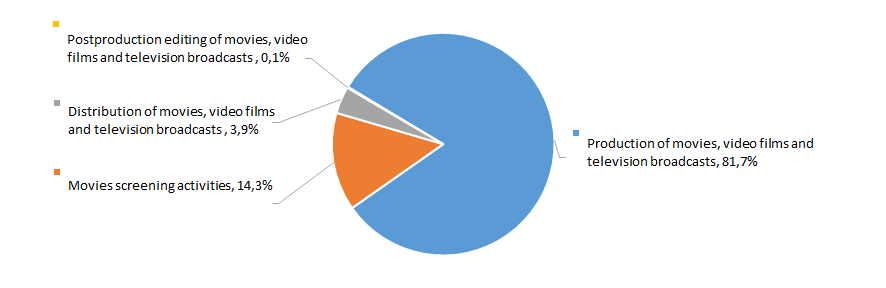 Picture 11. Distribution of TOP-3000 companies by types of output, %
Dynamics of business activity
Over a 25-year period, the registered companies from TOP-3000 list are unequally distributed by the year of foundation. Most of companies in the industry were founded in 2014. In general, increasing tendency for amount of registered companies is observed (Picture 12).
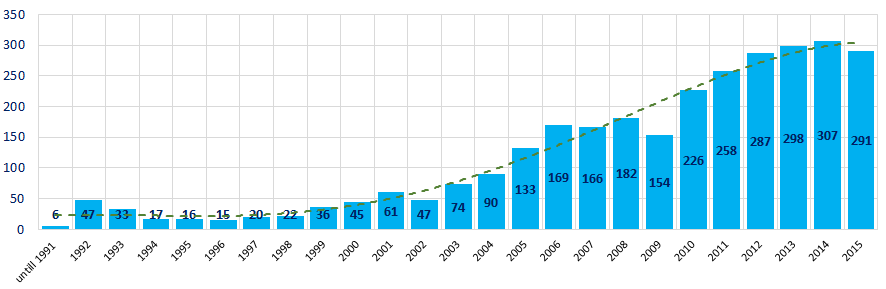 Picture 12. Distribution of TOP-3000 companies by years of foundation
Outstanding interest for production, distribution and release of motion pictures, video films and television broadcasts was paid after 2010 (Picture 13).
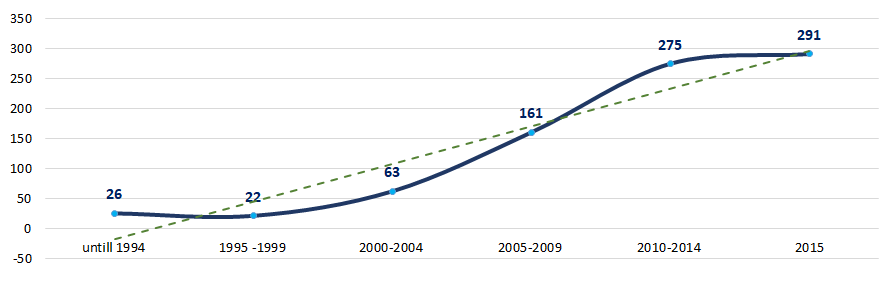 Picture 13. Average amount of TOP-3000 companies, registered per year, in terms of foundation periods
Main regions of activity
Film making companies are distributed unequally on the territory of the country. Most of the companies are registered in Moscow – the largest financial center of the country (Picture 14).
TOP-3000 companies are registered in 80 regions of Russia.
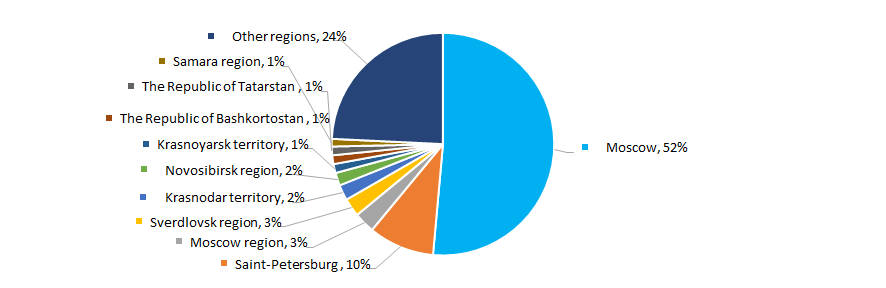 Picture 14. Distribution of TOP-3000 companies throughout regions of Russia
The majority of film making companies is centered in the Central Federal District of the RF (Picture 15).
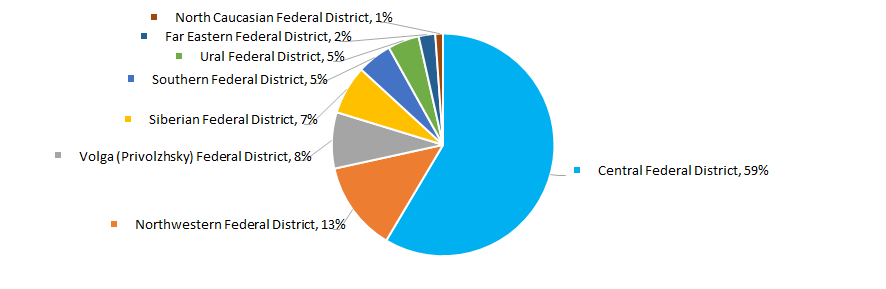 Picture 15. Distribution of TOP-3000 companies throughout federal districts of Russia
Share of companies from the TOP-3000 group, having branches or representative offices, amounts to 1,2%.
Participation in arbitration proceedings
Overwhelming majority of companies in the industry does not participate in arbitration proceedings or participate inactively (Picture 16).
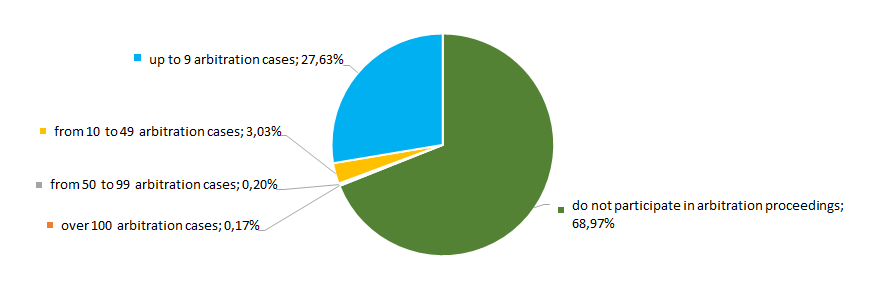 Picture 16. Distribution of TOP-3000 companies by participation in arbitration proceedings
Reliability index
In terms of signs of «fly-by-night» or unreliable companies the majority of companies demonstrate extremely low risk of cooperation (Picture 17).
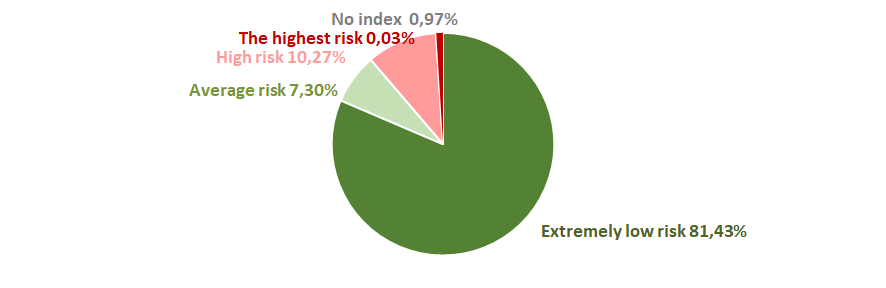 Picture 17. Distribution of TOP-3000 by Reliability index
Financial position score
Assessment of financial state of the sector’s companies indicates that the most of the companies have an average financial standing. However, share of companies that have unstable or critical financial standing amounts to significant amount of 40% (Picture 18).
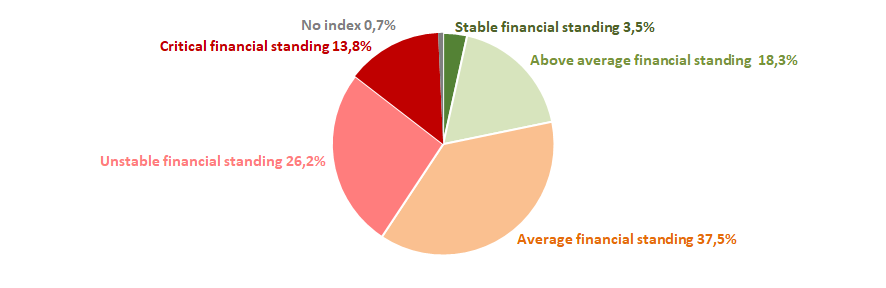 Picture 18. Distribution of TOP-3000 companies by Financial position score
Liquidity index
31% of the sector`s companies demonstrate an extremely low levels of bankruptcy risk in the short-term period. Companies with maximum and above average levels of risk make the same share (Picture 19).
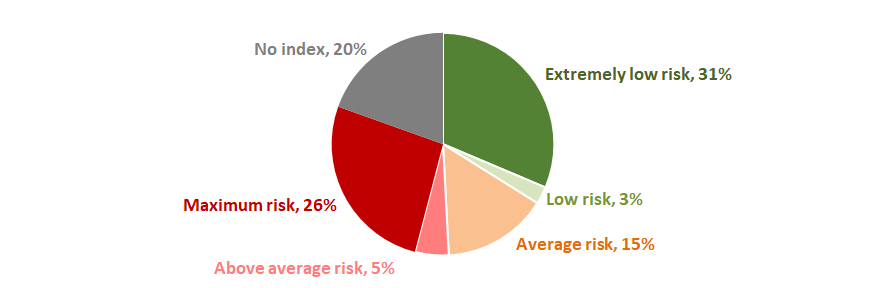 Picture 19. Distribution of TOP-3000 companies by Liquidity index
Solvency index Globas
Most of the TOP-3000 companies have got from superior to medium Solvency index Globas that shows their ability to pay debts in time and to the full extent (Picture 20).
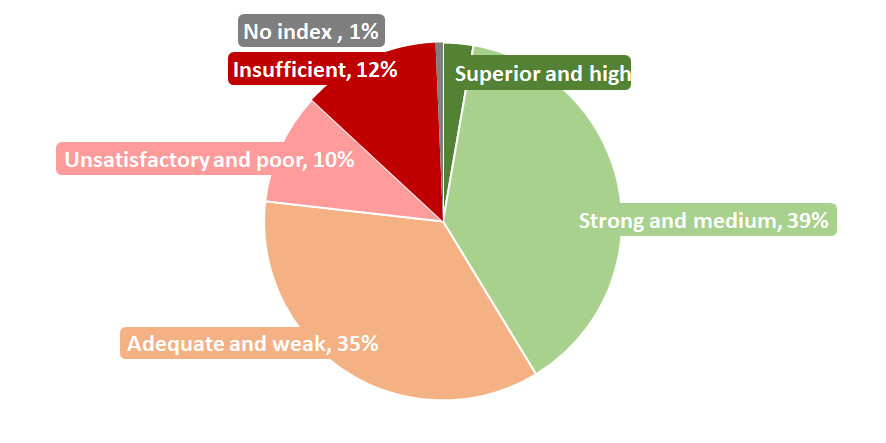 Picture 20. Distribution of TOP-3000 by Solvency index Globas
Therefore, complex assessment of film making companies, taking into accounts key indexes, financial figures and ratios, demonstrate relatively favorable trends within the industry.