
Order a report
Custom-made industry research, company ratings, competitor analysis

Trends in trade of electronic goods
Information agency Credinform has observed trends in the activity of the largest wholesalers of household electronics.
Enterprises with the largest volume of annual revenue (TOP-1000) were selected for the analysis, according to the data from the Statistical Register for the latest available periods (for 2013-2018). The analysis was made on the basis of the data of the Information and Analytical system Globas.
Net assets is an indicator, reflecting the real value of company's property, is calculated annually as the difference between assets on the enterprise balance and its debt obligations. The indicator of net assets is considered negative (insufficiency of property), if company’s debt exceeds the value of its property.
The largest company in the NCFD in terms of net assets amount is LLC KHASKEL, INN 7719269331, Moscow region. In 2018 net assets of the enterprise amounted to 15,7 billion RUB.
LLC OURSSON , INN 7743830082, Moscow had the smallest amount of net assets in the TOP-1000 group. Insufficiency of property of the company in 2018 was expressed in negative value -622 billion RUB.
For a ten-year period average amount of net assets of TOP-1000 companies has increasing tendency (Picture 1).
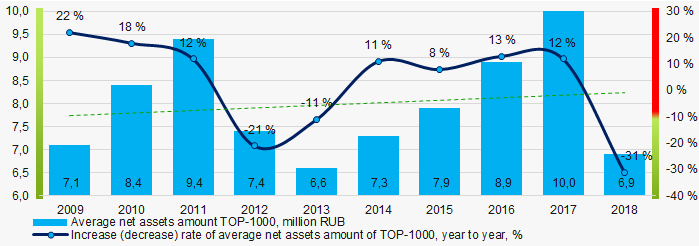 Picture 1. Change in average indicators of the net asset amount in 2009 – 2018
Share of companies with insufficiency of property in the TOP-1000 has decreasing tendency for the last five years (Picture 2).
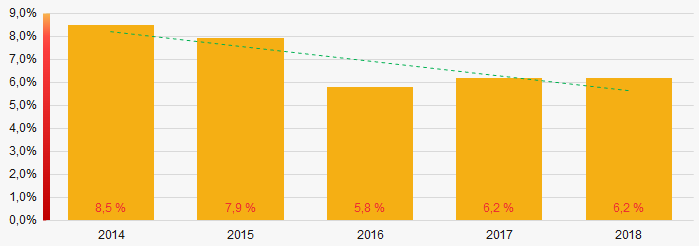 Picture 2. Shares of companies with negative values of net assets in TOP-1000 companies
 Sales revenue
The revenue volume of 10 leaders of the industry made 47% of the total revenue of TOP-1000 companies in 2018 (Picture 3). It demonstrates relatively high level of monopolization.
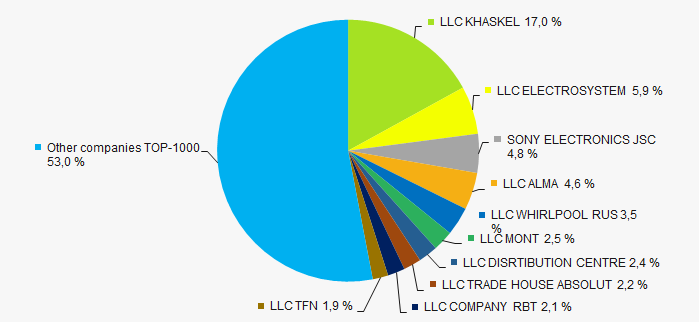 Picture 3. Shares of participation of TOP-10 companies in the total revenue of TOP-1000 companies for 2018
In general, an increasing tendency in revenue volume is observed (Picture 4).
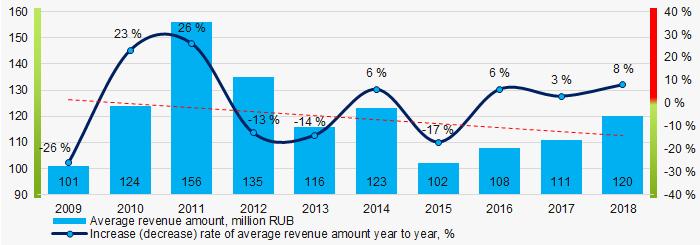 Picture 4. Change in the average revenue in 2009 – 2018
Profit and losses
The largest company in terms of net profit amount is also LLC KHASKEL, INN 7719269331, Московская область. The profit in 2018 amounted to 2,4 billion RUB.
Over a ten-year period average indicators of net profit for TOP-1000 group have a decreasing tendency (Picture 5).
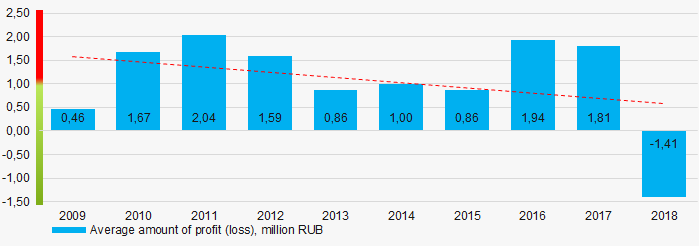 Picture 5. Change in the average indicators of net profit of TOP-1000 companies in 2009 – 2018
Over a five-year period, the average values of net profit indicators of TOP-1000 companies tend to increase. Besides, the average value of net loss decreases (Picture 6).
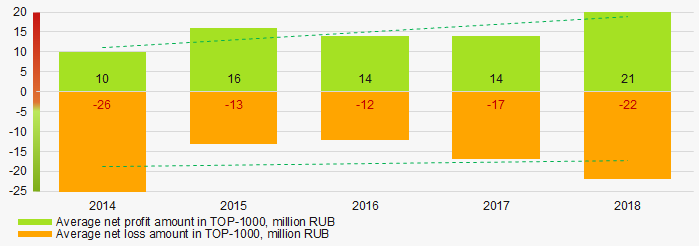 Picture 6. Change in the average indicators of net profit and loss of TOP-1000 companies in 2014 – 2018
Key financial ratios
Over the five-year period the average indicators of the current liquidity ratio of TOP-1000 in general were within the range of recommended values – from 1,0 up to 2,0 with increasing tendency (Picture 7).
The current liquidity ratio (the relation of the amount of current assets to short-term liabilities) shows the sufficiency of company’s funds for repayment of its short-term liabilities.
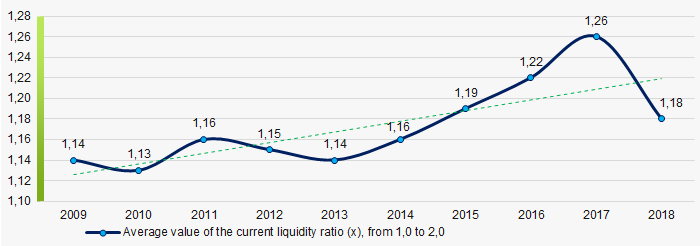 Picture 7. Change in the average values of the current liquidity ratio of TOP-1000 companies in 2009 – 2018
A decreasing tendency of the average values of the indicators of the return on investment ratio has been observed for ten years (Picture 8).
The ratio is calculated as the relation of net profit to the sum of own capital and long-term liabilities and demonstrates the return on the equity involved in the commercial activity of own capital and the long-term borrowed funds of an organization.
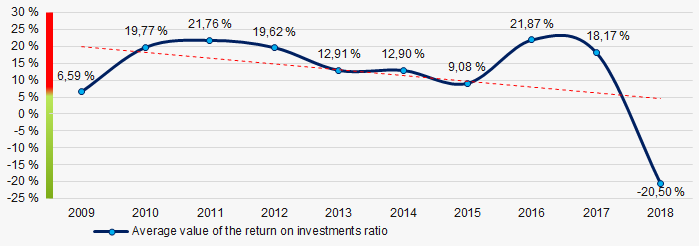 Picture 8. Change in the average values of the return on investment ratio of TOP-1000 companies in 2009 – 2018
Asset turnover ratio is calculated as the relation of sales revenue to the average value of total assets for a period and characterizes the efficiency of use of all available resources, regardless of the sources of their attraction. The ratio shows how many times a year a complete cycle of production and circulation is made, yielding profit.
This business activity ratio showed a tendency to decrease for a ten-year period (Picture 9).
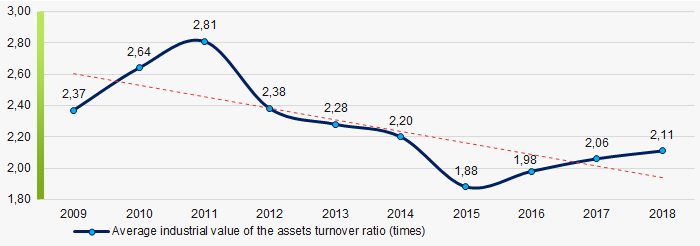 Picture 9. Change in the average values of the assets turnover ratio of TOP-1000 companies in 2009 – 2018
Small business
90% of the TOP-1000 companies are registered in the Register of small and medium enterprises of the Federal Tax Service of Russia. Besides, share of revenue in the total volume is 22,6%, that is higher than the average indicator countrywide (Picture 10).
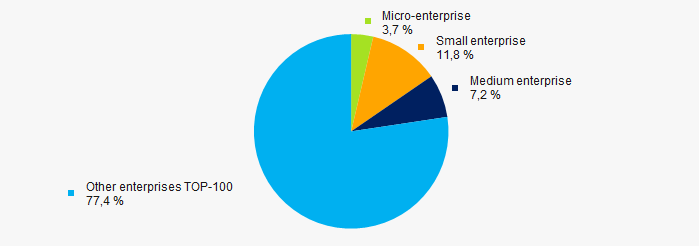 Picture 10. Shares of small and medium enterprises in TOP-1000 companies
Main regions of activity
TOP-1000 enterprises that registered in 70 regions and are unequally distributed along the country. Almost 76% are located in Moscow and Moscow region (Picture 11).
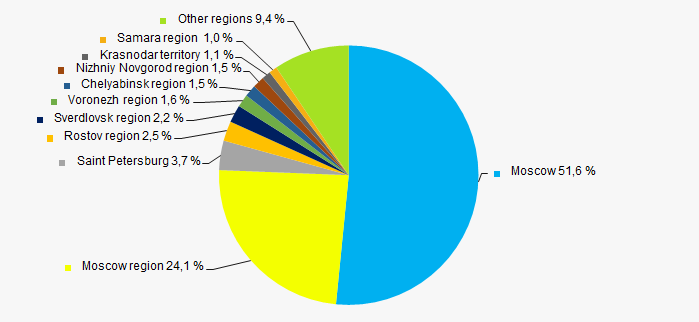 Picture 11. Distribution of revenue TOP-1000 companies by regions of Russia
 Financial position score
An assessment of the financial position of TOP-1000 companies shows that the largest number is in an above average financial position. (Picture 12).
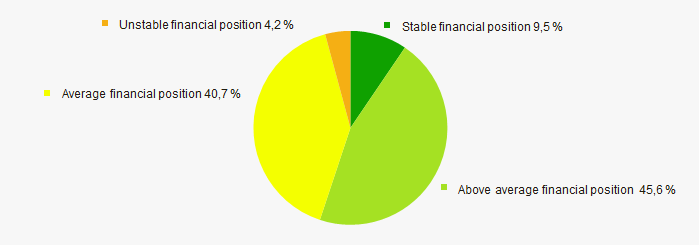 Picture 12. Distribution of TOP-1000 companies by financial position score
Solvency index Globas
Most of TOP-1000 companies have got from Medium to Superior Solvency index Globas, that points to their ability to repay their debts in time and fully (Picture 13).
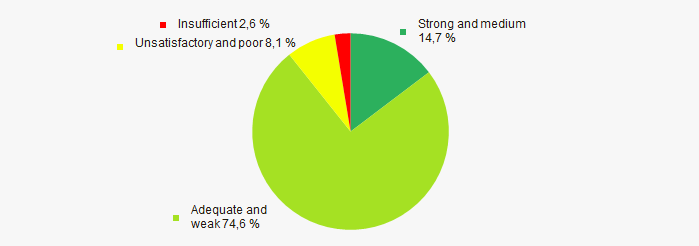 Picture 13. Distribution of TOP-1000 companies by solvency index Globas
According to the data from the Federal State Statistics Service, share of enterprises of wholesale of household electronics in the total revenue volume from sale of goods, products, works, services countrywide for 2018 amounted to 0,474%, and 0,436% - for 9 months of 2019, that is higher that the indicator for 9 months of 2018, amounted to 0,360%.
Conclusion
Comprehensive assessment of the activity of the largest enterprises of wholesale of household electronics, taking into account the main indexes, financial indicators and ratios, demonstrates the presence of favorable trends (Table 1)
| Trends and assessment factors | Share of factor, % |
| Rate of increase (decrease) of average amount of net assets |  10 10 |
| Increase / decrease of share of companies with negative values of net assets | 10 |
| Level of competition/monopolization |  -10 -10 |
| Increase (decrease) rate of average revenue amount | -10 |
| Increase (decrease) rate of average net profit (loss) amount | -10 |
| Increase / decrease of average net profit amount of TOP-1000 companies | 10 |
| Increase / decrease of average net loss amount of TOP-1000 companies | 10 |
| Increase / decrease of average industrial values of the current liquidity ratio | 10 |
| Increase / decrease of average industrial values of the return on investments ratio | -10 |
| Increase / decrease of average industrial values of the assets turnover ratio, times | -10 |
| Share of small and medium enterprises in the industry in terms of revenue volume more than 22% | 10 |
| Regional concentration | -10 |
| Financial position (major share) | 10 |
| Solvency index Globas (major share) | 10 |
| Dynamics of shares of companies of the industry in the total revenue volume from sale of goods, products, works, services countrywide | 10 |
| Average value of factors | 2,0 |
positive trend (factor), negative trend (factor).