Information agency Credinform presents ranking of the largest Russian pharma companies. Enterprises with the largest volume of annual revenue (TOP-10), engaged in manufacture of pharmaceuticals and medical products, were selected for the analysis, according to the data from the Statistical Register for the latest available periods (for 2016-2018). Then they were ranked by decrease in product profitability ratio (Table 1). The analysis was made on the basis of the data of the Information and Analytical system Globas.
Product profitability (%) is calculated as the ratio of sales profit to expenses from ordinary activities.
In general, profitability reflects the economic efficiency of production. Product profitability analysis allows us to make a conclusion whether output of one or another product is reasonable. There are no prescribed values for indicators of this group, because they vary strongly depending on the industry.
The experts of the Information agency Credinform, taking into account the actual situation both in the economy as a whole and in sectors, has developed and implemented in the Information and Analytical system Globas the calculation of practical values of financial ratios that can be recognized as normal for a particular industry. For manufacturers of pharmaceuticals and medical products practical value of the product profitability ratio amounted from 25,32% in 2017.
For getting of the most comprehensive and fair picture of the financial standing of an enterprise it is necessary to pay attention to all combination of indicators and financial ratios.
Name, INN, region | Revenue, billion RUB | Net profit (loss), billion RUB | Product profitability ratio, % | Solvency index Globas | |||
2017 | 2018 | 2017 | 2018 | 2017 | 2018 | ||
1 | 2 | 3 | 4 | 5 | 6 | 7 | 8 |
JSC BIOCAD INN 5024048000 Saint Petersburg |
![]() |
![]() |
![]() |
![]() |
![]() |
![]() |
145 Superior |
JSC VALENTA FARM INN 5050008117 Moscow region |
![]() |
![]() |
![]() |
![]() |
![]() |
![]() |
163 Superior |
JSC Nizhpharm INN 5260900010 Novgorod region |
![]() |
![]() |
![]() |
![]() |
![]() |
![]() |
173 Superior |
JSC PHARMSTANDART-LEKSREDSTVA INN 4631002737 Kursk region |
![]() |
![]() |
![]() |
![]() |
![]() |
![]() |
203 Strong |
LLC OZON INN 6345002063 Samara region |
![]() |
![]() |
![]() |
![]() |
![]() |
![]() |
189 High |
JSC CHEMICO-PHARMACEUTICAL WORKS AKRIKHIN INN 5031013320 Moscow region |
![]() |
![]() |
![]() |
![]() |
![]() |
![]() |
156 Superior |
JSC R-FARM INN 7726311464 Moscow |
![]() |
![]() |
![]() |
![]() |
![]() |
![]() |
196 High |
JSC SOTEX PHARMFIRM INN 7715240941 Moscow region |
![]() |
![]() |
![]() |
![]() |
![]() |
![]() |
151 Superior |
JSC PHARMSTANDARD-UFIMSKIY VITAMIN PLANT INN 0274036993 The Republic of Bashkortostan |
![]() |
![]() |
![]() |
![]() |
![]() |
![]() |
187 High |
JSC RICHTER GEDEON-RUS INN 5011016121 Moscow region |
![]() |
![]() |
![]() |
![]() |
![]() |
![]() |
213 Strong |
Total for TOP-10 companies | ![]() |
![]() |
![]() |
![]() |
|||
Average value for TOP-10 companies | ![]() |
![]() |
![]() |
![]() |
![]() |
![]() |
|
Average industrial value | ![]() |
![]() |
![]() |
growth decrease of indicator to the previous period,
decrease of indicator to the previous period.
Average value of the product profitability ratio of the TOP-10 group is higher than the average industrial and practical values of 2017. Four companies have improved their results in 2018.
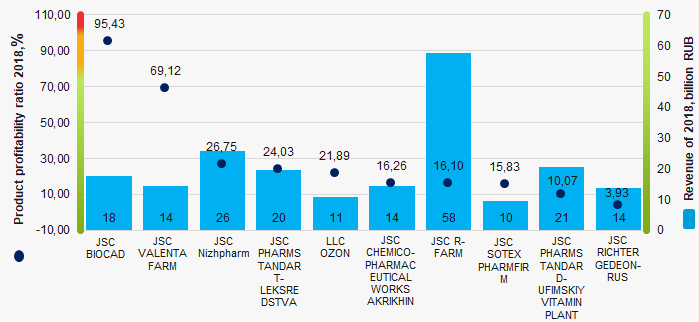
Over a ten-year period average industrial values of the product profitability ratio had increasing tendency. (Picture 2).
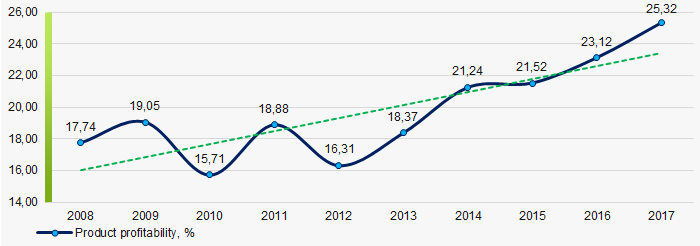
On August 1, 2019, the Federal Tax Service of Russia (FTS) disclosed information on average number of employees, applying special tax regimes by companies, and inclusion in consolidated group of taxpayers for 2018.
1 or 0 employee is the average number of stuff in 56% of companies in Russia.
Data on the average number of employees for 2018 is disclosed for 2,4 million legal entities (out of 4,1 million legal entities on December 2018). Detailed data structure is presented on Picture 1.
The companies are obliged to submit data of the average number of stuff to the FTS, even if there are no regular employees.
One of the reasons there are companies with small and zero number of employees is that part-timers and contractors are not included in the number of stuff. The other reason is tax optimization. The labor compensation fund is obliged to pay social due that is why the employers do not take on stuff.
At counterparties check, the number of stuff is necessary to be taken into account. Companies with 0 or 1 employee are at the risk, because small or zero number of employees is one of the negative signs.
Excluding statistical companies, major taxpayers and enterprises of defense industry, data on which will be disclosed on 2020, the largest Russian company in term of the number of stuff in 2018 is JSC Svyaznoy Logistics with 16 276 employees. The company is dissolved due to the reorganization in the form of acquisition by LLC Svyaznoy Chain (see Table 1).
Table 1. Top-10 of the Russian companies by the average number of employees
Rank | Company | Average number of employees in 2018 | Revenue in 2018, million RUB |
1 | JSC SVYAZNOY LOGISTICS | 16 276 | 109 862 |
2 | LLC GAZSTROY | 16 112 | 36 146 |
3 | LLC SIBERIAN INTERNET COMPANY | 15 334 | 49 298 |
4 | JSC ILIM GROUP | 14 963 | 155 701 |
5 | JSC ER-TELECOM HOLDING | 14 737 | 34 979 |
6 | LLC ELDORADO | 13 620 | *110 406 |
7 | LLC SELTA (Magnit Group) | 13 007 | 38 531 |
8 | LLC RUSSIAN ENGINEERING COMPANY | 12 680 | 32 870 |
9 | LLC UNITED SERVICE COMPANY | 12 609 | 12 749 |
10 | JSC MEGAFON RETAIL | 11 360 | 41 035 |
(*) data on 2017
Simplified tax system (STS) is the most spread tax regime in Russia.
According to the FTS, 89% or 1,4 million out of 1,6 million companies having applied one or several special tax regimes, use simplified tax system (Picture 2). 5% of legal entities combine STS and imputed income of individual entrepreneurs (UTII). Special tax regime allows companies to pay one general tax at reduced rate instead of income tax, property tax and VAT.
Criteria of applying special tax regimes help to have an overall characteristics of business at the counterparty analysis: to assess total income, net assets value, number of employees, field of activity.
The fact of applying the STS by the counterparty is indicative of income not exceeding 150 million RUB per year, the number of stuff is up to 100 employees, the cost of fixed assets is less than 150 million RUB, the counterparty does not belong to organizations activities of which are especially strictly controlled by the state (banks, insurance companies, manufacturers of excisable goods, budget institutions), does not pay income taxes, taxes on property of organizations and VAT.
Participation in the consolidated group of taxpayers is the prerogative of large business.
Consolidated group of taxpayers is a voluntary association of organizations created to pay income tax on consolidated financial result of the entire group. Responsible member of the consolidated group is assigned to calculate and pay income tax.
Consolidated group of taxpayers can be created if one company directly or indirectly participates in the authorized capital of other companies, and the share of such participation in each legal entity is at least 90%.
According to the data for 2018, the FTS published information on 210 responsible members of the consolidated group. In 2017, there were 88 such participants.
While checking business partners or counterparties, their participation in consolidated group of taxpayers is indicative of belonging to a vertically integrated holding headed by major taxpayers, taxation and business of which are strictly controlled and extremely transparent.
Data, publication of which on the FTS resource is expected by the year-end, will also be placed in Globas:
On October 1, 2019, the FTS plans to publish information on income and expenses from the financial statements of organizations, as well as information on taxes, fees and insurance contributions paid in 2018.
On December 1, 2019, the FTS is expected to disclose information on arrears, tax debts, arrears of insurance premiums, and information on tax violations.