
Order a report
Custom-made industry research, company ratings, competitor analysis


Net profit ratio of distributors of pharmaceutical products
Information agency Credinform prepared a ranking of distributors of pharmaceutical products.
The companies with the highest volume of revenue were selected for this ranking according to data from the Statistical Register for the latest available period (for the year 2012). These enterprises were ranked by decrease in net profit ratio.
Net profit ratio (%) is the relation of net profit (loss) of a company to sales revenue. It shows how profitable were sales of a company.
There is no specified value, that’s way it is recommended to compare companies of the same branch or ratio's change with time in one specific organization. If the indicators are negative, it means that company has a net loss. The higher is the net profit ratio, the more effective is finally company’s activity.
For getting of the most comprehensive and fair picture of the financial standing of an enterprise it is necessary to pay attention not only to industry-average indicators in the branch, but also to all presented combination of financial data.
| № | Name | Region | Turnover, in mln RUB, for 2012 | Net profit ratio, % | Solvency index GLOBAS-i® |
|---|---|---|---|---|---|
| 1 | DZHONSON & DZHONSON LLC INN: 7725216105 |
Moscow | 43 910,1 | 9,2 | 223 high |
| 2 | SANOFI ROSSIYA CJSC INN: 7705018169 |
Moscow | 29 734,3 | 4,4 | 223 high |
| 3 | NAUCHNO-PROIZVODSTVENNAYA KOMPANIYA KATREN CJSC INN: 5408130693 |
Novosibirsk region | 101 206,7 | 2,2 | 201 high |
| 4 | FARMATSEVTICHESKY IMPORT, EKSPORT OJSC INN: 7710106212 |
Moscow | 16 594,2 | 0,9 | 261 high |
| 5 | ROSTA CJSC INN: 7726320638 |
Moscow region | 58 880,0 | 0,6 | 226 high |
| 6 | FIRMA TSENTR VNEDRENIYA PROTEK CJSC INN: 7724053916 |
Moscow | 109 120,5 | 0,5 | 245 high |
| 7 | SIA INTERNEYSHNL LTD CJSC /(SIA INTERNATIONAL Ltd) INN: 7714030099 |
Moscow | 81 537,6 | 0,3 | 255 high |
| 8 | TAKEDA FARMASYUTIKALS LLC INN: 7711067140 |
Moscow | 16 423,2 | -0,3 | 287 high |
| 9 | BAYER CJSC INN: 7704017596 |
Moscow | 24 806,9 | -0,7 | 294 high |
| 10 | ORIOLA LLC INN: 7704150140 |
Moscow region | 33 506,1 | -1,5 | 302 satisfactory |
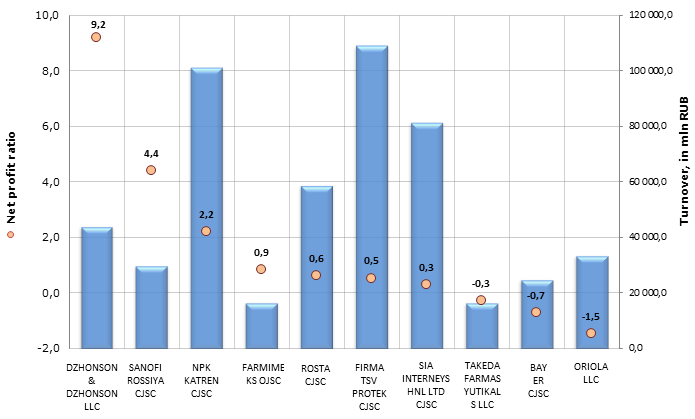
Picture. Net profit ratio, turnover of the largest distributors of pharmaceutical products (TOP-10)
The ranking includes enterprises involved mainly in distribution (and not in own production) of pharmaceuticals to retail networks of the country.
Turnover of the largest distributers of pharmaceutical products (TOP-10) made 515 719,6 bln RUB, according to the latest published financial statement. The leaders accumulate up to 35% of sales revenue of all participants of the branch. The average net profit ratio of TOP-10 companies is 1,6%.
NPK KATREN CJSC and PROTEK CJSC have the revenue above 100 bln RUB and are the main players in Russian pharmaceutical market. The net profit ratio by these enterprises is respectively - 2,2% and 0,5%. By comparable turnover of both organizations, NPK KATREN CJSC yields more net profit to its founders after deduction of all expenses, i.e. the business is more effective.
NPK KATREN CJSC takes the first place in the overall ranking of pharmaceutical distributors on the share of direct supplies of medical products and the gross sales.
Tsentr vnedreniya PROTEK is one of the largest national distributors of pharmaceutical products and goods for beauty and health in Russia. The company carries out its activity in 83 territorial entities of the RF. The regional network includes 6 interregional logistic centers, 28 branches with full-service warehouses, 9 branches with storage depots and 43 regional trade representations.
According to the independent estimation of the Information agency Credinform, the organizations of the TOP-10 list got a high solvency index (except ORIOLA LLC), what can signal to an potential investor, that the largest market players can pay off their debts in time and fully, while risk of default is minimal.
See also: Net profit ratio of the largest publishers of newspapers and magazines in Russia