Article
Check on engagement in terrorism

Entrepreneurs providing legal or accounting services are obliged by the Federal Financial Monitoring Service (Rosfinmonitoring) to check their clients on participation in shady financial transactions and terrorism.

Clarifications are given in the Information letter of the Rosfinmonitoring №54 from July 19, 2018.

According to the Federal law «On Combating Legalization (Laundering) of Proceeds from Crime and Financing of Terrorism» from August 7, 2001 №115-FL, in case of any suspicions on legalization of clients` income, it is necessary to identify them and inform the Rosfinmonitoring.

These requirements, in accordance with the Article 7.1 of the115-FL concern attorneys, notary officers and other legal persons, in case when they on behalf of their clients:

  • make real estate transactions;
  • operate monetary funds, securities or property, banking or security accounts;
  • attract monetary funds of organizations for their foundation, operation or management;
  • found organizations, carry out activities or manage them;
  • make transactions of purchase and sale of organizations.

Clause 2 of the Article 7.1 of the115-FL explicitly refers to the obligation of persons providing legal and accounting services to inform the Rosfinmonitoring if they have any reason to suppose that their clients` transactions or financial operations are or may be carried out for legalization of income, received by criminal means or financing of terrorism.

Procedure for transmission of such data to the Rosfinmonitoring is defined by the Decision of the Government of the RF №82 from February 16, 2005.

Form of data representation, coding form, code list able for use, other peculiarities of data representation, information and telecommunication networks used for data transmission in electronic format are regulated by the Directive approved by the Order of the Rosfinmonitoring №10 from April 22, 2015.

According to the clause 2.8 of the Directive, representation of formalized electronic messages, containing transmitted data, is carried out only with the use of personal account on the official web-site of the Rosfinmonitoring.

Foregoing requirements are also applicable to registrars – to the full extent, and court-appointed managers – in cases when they provide other additional types of professional activities listed in the Federal Law №115.

Legal entities and individual entrepreneurs, providing legal and accounting services, are obliged to have internal check rules and a special executive, responsible for compliance with the rules. Competence requirements, training and teaching requirements for such executives are approved by the Decision of the Government №492 of the RF from May 29, 2014.

According to the data from the Federal State Statistics Service for the first half-year period of 2018, the Federal Financial Monitoring Service made 223 investigations regarding legal entities and individual entrepreneurs. In 2012 – 2015 almost every investigation ended with initiation of cases concerning administrative offences and (or) imposition of administrative fines. Over the last years, amount of revealed major violations is decreasing. (Picture 1).

Picture 1. Investigations of the Rosfinmonitoring concerning legal entities and individual entrepreneurs in 2012 – 2018 (items) 
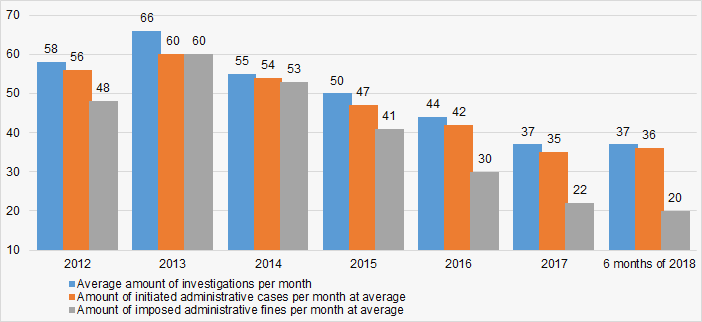
Picture 1. . Investigations of the Rosfinmonitoring concerning legal entities and individual entrepreneurs in 2012 – 2018 (items)

Link to «List of organizations and individuals known for their engagement in extremist activities or terrorism» can be found in the section «Useful links» of the Information and Analytical system Globas.

Article
Trends in the activity of Dagestani companies

Information agency Credinform represents an overview of activity trends of the largest companies in the real sector of the economy of the Republic of Dagestan.

The enterprises with the largest volume of annual revenue in the real sector of the economy of the Republic of Dagestan (TOP-10 and TOP-1000) were selected for the analysis, according to the data from the Statistical Register for the latest available periods (for 2012 - 2017). The analysis was made on the basis of the data of the Information and Analytical system Globas.

Net assets are an indicator, reflecting the real value of company’s property, is calculated annually as the difference between assets on the enterprise balance and its debt obligations. The indicator of net assets is considered negative (insufficiency of property), if company’s debt exceeds the value of its property.

Table 1. The largest companies in the real sector of the economy of the Republic of Dagestan with he largest and smallest values of net assets in 2013 – 2017
Name, INN,
type of activity
Net assets value,
bln RUB
Solvency index Globas
2013 2014 2015 2016 2017
1 2 3 4 5 6 7 8
1 KIZLYARSKII KONYACHNYI ZAVOD PJSC
INN 0547011052
Production of distilled drinking alcoholic beverages: vodka, whiskey, brandy, gin, liqueurs, etc.
up4.42 up4.69 up5.00 up5.37 up5.52 231 Strong
2 GAZPOM TRANSGAZ MAKHACHKALA LLC
INN 0500000136
Transportation of gas and products of its processing through pipelines
down5.32 down4.64 up4.66 down4.39 н/д 208 Strong
3 DERBENT COGNAC PLANT NJSC
INN 0542003065
Production of food alcohol
up3.73 up4.04 up4.14 up4.35 up4.45 218 Strong
4 MAKHACHKALINSKII MORSKOI TORGOVYI PORT NJSC
INN 0573008521
Cargo handling
down1.85 down1.79 up1.91 down1.89 down0.60 268 Medium
5 DAGNEFTEGAS NJSC
INN 0515012247
Extraction of natural gas and gas condensate
up1.34 up1.53 up1.66 down1.61 down1.47 289 Medium
996 MAKHACHKALAVODOKANAL PJSC
INN 0560037035
Distribution of water for drinking and industrial needs
down-0.14 down-0.36 down-0.60 down-0.83 down-1.06 317 Adequate
997 GAZPROM GAZORASPREDELENIE DAGESTAN
INN 0561049072
Transportation of gas through pipelines
down-1.98 down-2.65 down-3.42 down-3.89 down-4.58 340 Adequate
998 DAGESTANSKAYA SETEVAYA KOMPANIYA NJSC
INN 2632800485
Transmission of electricity and technological connection to distribution networks
up0.03 down0.00 down-1.15 down-4.49 down-8.85 350 Adequate
999 CASPIAN FLAT GLASS NJSC
INN 0522016027
Production of flat glass
Case on declaring the company bankrupt (insolvent) is proceeding
down-0.57 down-3.00 down-6.06 down-6.90 down-10.24 550 Insufficient
1000 DAGESTANSKAYA ENERGOSBYTOVAYA KOMPANIYA PJSC
INN 0541031172
Sale of electric power
down-8.91 down-10.87 down-14.92 down-18.47 down-24.23 309 Adequate

Up — increase in the indicator to the previous period, Up — decrease in the indicator to the previous period.

The average values of net assets of TOP-1000 enterprises tend to decrease over the five-year period (Picture 1).

Picture 1. Change in average indicators of the net asset value of TOP-1000 companies in 2012 – 2016 Picture 1. Change in average indicators of the net asset value of TOP-1000 companies in 2012 – 2016

The share of enterprises with insufficiency of assets tend to grow over the five-year period (Picture 2).

Picture 2. Share of enterprises with negative values of net assets in TOP-1000 Picture 2. Share of enterprises with negative values of net assets in TOP-1000

Sales revenue
The revenue volume of 10 industry leaders made 41% of the total revenue of TOP-1000 companies in 2016. (Picture 3). It points to a relatively high level of capital concentration in the Republic of Dagestan.

Picture 3. Shares of participation of TOP-10 companies in the total revenue of TOP-1000 enterprises for 2016 Picture 3. Shares of participation of TOP-10 companies in the total revenue of TOP-1000 enterprises for 2016

In general, there is a trend towards an increase in revenue volume (Picture 4).

Picture 4. Change in the average revenue of TOP-1000 companies in 2012 – 2016 годах Picture 4. Change in the average revenue of TOP-1000 companies in 2012 – 2016 годах

Profit and losses
The profit volume of 10 industry leaders made 54% of the total profit of TOP-1000 companies in 2016 (Picture 5).

Picture 5. Shares of participation of TOP-10 companies in the total volume of profit of TOP-1000 Picture 5. Shares of participation of TOP-10 companies in the total volume of profit of TOP-1000

Average values of net profit’s indicators of TOP-1000 companies do not to increase over the five-year, while the average size of net loss increases (Picture 6).

Picture 6. Изменение средних значений показателей прибыли и убытка компаний ТОП-1000 в 2012 – 2016 годах Picture 6. Change in the average values of indicators of profit and loss of TOP-1000 companies in 2012 – 2016

Key financial ratios
Over the five-year period the industry average indicators of the total liquidity ratio were much higher than the interval of recommended values - from 1.0 up to 2.0, with a tendency to increase (Picture 7).

The total liquidity ratio (the relation of the amount of current assets to short-term liabilities) shows the sufficiency of company’s funds for repayment of its short-term liabilities.

Picture 7. Change in average values of the total liquidity ratio of TOP-1000 companies in 2012 – 2016 Picture 7. Change in average values of the total liquidity ratio of TOP-1000 companies in 2012 – 2016

There is a high level of average values of the return on investment ratio within five years, with a tendency to some decrease return on investment ratio within five years, with a tendency to some decrease (Picture 8).

The ratio is calculated as the relation of net profit to the sum of own capital and long-term liabilities and demonstrates the return on the equity involved in the commercial activity of own capital and the long-term borrowed funds of an organization.

Picture 8. Change in average values of the return on investment ratio of TOP-1000 companies in 2012 – 2016 Picture 8. Change in average values of the return on investment ratio of TOP-1000 companies in 2012 – 2016

Asset turnover ratio is calculated as the relation of sales proceeds to the average value of total assets for a period and characterizes the efficiency of use of all available resources, regardless of the sources of their attraction. The ratio shows how many times a year a complete cycle of production and circulation is made, yielding profit.

This ratio of business activity showed a tendency to decrease over the five-year period (Picture 9).

Picture 9. Change in average values of the asset turnover ratio of TOP-1000 companies in 2012 – 2016 Picture 9. Change in average values of the asset turnover ratio of TOP-1000 companies in 2012 – 2016

Production structure
The largest share in the total revenue of TOP-1000 is owned by companies, specializing in provision of electric power, gas and steam, as well as wholesale (Picture 10).

Picture 10. Distribution of types of activity in the total revenue of TOP-1000 companies Picture 10. Distribution of types of activity in the total revenue of TOP-1000 companies

48% of TOP-1000 companies are registered in the Register of small and medium-sized businesses of the Federal Tax Service of the RF (Picture 11).

Picture 11. Shares of small and medium-sized businesses in TOP-1000 companies Picture 11. Shares of small and medium-sized businesses in TOP-1000 companies

Financial position score
An assessment of the financial position of TOP-1000 companies shows that their the largest number are in the average financial position (Picture 12).

Picture 12. Distribution of TOP-1000 companies by financial position score Picture 12. Distribution of TOP-1000 companies by financial position score

Solvency index Globas
Most of TOP-1000 companies got Strong or Medium Solvency index Globas, that points to their ability to pay off their debts in time and fully (Picture 13).

Picture 13. Distribution of TOP-1000 companies by solvency index Globas Picture 13. Distribution of TOP-1000 companies by solvency index Globas

Conclusion
A comprehensive assessment of activity of the largest companies in the real sector of the economy of the Republic of Dagestan, taking into account the main indices, financial indicators and ratios, points to favorable trends, such as revenue growth, a high level of total liquidity and return on investment ratios. However, alarming and negative factors are: decrease in the average size of net assets and an increase in the share of companies with insufficiency of property, growing net losses, trends in the decline in the return on investment and asset turnover ratios

According to the Federal Service of State Statistics, there is a tendency to increase the industrial production index in the Republic of Dagestan in 2017 – 2018, higher than Russia average. Thus, for 8 months of 2018 the industrial production index increased on average by 7,5%, and in general for the period 2017 - 2018 - by 3% (Picture 14).

Picture 14. Industrial production index in the Republic of Dagestan in 2017 – 2018, month-over-month (%) Picture 14. Industrial production index in the Republic of Dagestan in 2017 – 2018, month-over-month (%)

According to the same information, the share of the Republic of Dagestan in the amount of proceeds from the sale of goods, products, works, services countrywide made 0,06% for 8 months of 2018.