
Order a report
Custom-made industry research, company ratings, competitor analysis


Dependence on loans in the field of tourism
Information agency Credinform represents the ranking of the largest Russian travel companies. The enterprises with the largest volume of annual revenue (TOP-10) involved in tourist activity were selected for the ranking, according to the data from the Statistical Register for the latest available periods (for 2014 – 2017). Then they were ranked by solvency ratio (Table 1). The analysis was made on the basis of the data of the Information and Analytical system Globas.
Solvency ratio (х) is calculated as the relation of the amount of equity capital to balance sum and shows company's dependence on external loans.
Recommended value is: >0,5. The ratio value below the minimum recommended limit means a dependence on external sources of financing that may adversely impact liquidity and lead to an unstable financial situation of the company in case of a worsening economic situation. The experts of the Information agency Credinform,taking into account the actual situation both in the economy as a whole and in the sectors, has developed and implemented in the Information and Analytical system Globas the calculation of practical values of financial ratios that can be recognized as normal for a particular industry. For travel companies industry average practical values of the solvency ratio made from 0,00 up to 1,00 in 2017 (Table 1).
For getting of the most comprehensive and fair picture of the financial standing of an enterprise it is necessary to pay attention to all combination of indicators and financial ratios.
| Name, INN, region, type of activity | Sales revenue, bln RUB | Net profit (loss), bln RUB | Solvency index (x), >0,5 | Solvency index Globas | |||
| 2016 | 2017 | 2016 | 2017 | 2016 | 2017 | ||
| 1 | 2 | 3 | 4 | 5 | 6 | 7 | 8 |
| VODOHOD LLC INN 7707511820 Moscow Activity of travel agencies and tour operators |
|
|
|
|
|
|
192 High |
| Meridian Company Limited INN 5042054053 Moscow region Activity of travel agencies |
|
|
|
|
|
|
224 Strong |
| LLC Internet Travel INN 7705859041 Moscow Activity of travel agencies |
|
|
|
|
|
|
279 Medium |
| Club Med Russia LLC INN 7705549346 Moscow Activity of travel agencies |
|
|
|
|
|
|
254 Medium |
| CITY BOOKING & TRAVEL CENTRE, TRADING HOUSE, LLC INN 5003103814 Moscow region Activity of travel agencies |
|
|
|
|
|
|
243 Strong |
| AEROKLUB TUR LLC INN 7702520780 Moscow Activity of travel agencies |
|
|
|
|
|
|
209 Strong |
| AEROCLUB LLC INN 7729096230 Moscow Other reservation services and related activities |
|
|
|
|
|
|
215 Strong |
| S 7 TRAVEL RETAIL LLC INN 7701607660 Moscow Activity of travel agencies |
|
|
|
|
|
|
193 High |
| Hotelbook-Service LLC INN 7709878038 Moscow Activity for the provision of travel services related to reservation |
|
|
|
|
|
|
227 Strong |
| ACADEMSERVICE LTD INN 5024053441 Moscow region Activity of travel agencies |
|
|
|
|
|
|
197 High |
| Total by TOP-10 companies | |
|
|
|
|||
| Average value by TOP-10 companies | |
|
|
|
|
|
|
| Industry average value | |
|
|
|
|
|
|
![]() — improvement of the indicator to the previous period,
— improvement of the indicator to the previous period, ![]() — decline in the indicator to the previous period.
— decline in the indicator to the previous period.
The average value of the solvency ratio of TOP-10 enterprises is above the industry average indicator and fits within the range of practical values. In 2017, seven companies from the TOP-10 list improved indicators compared with the previous period.
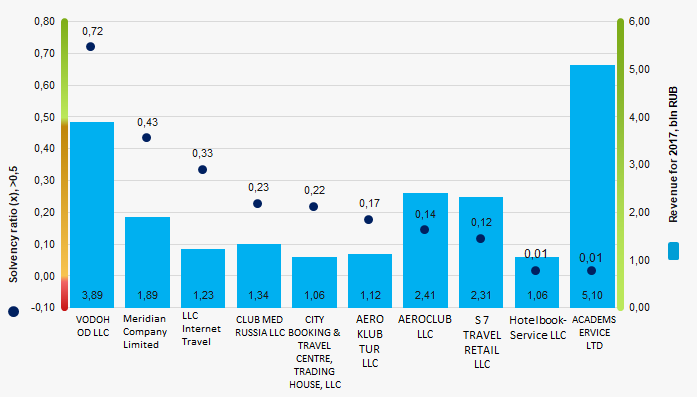 Picture 1. Solvency ratio and revenue of the largest Russian travel companies (TOP-10)
For ten years, the industry average indicators of the solvency ratio tend to decrease (Picture 2).
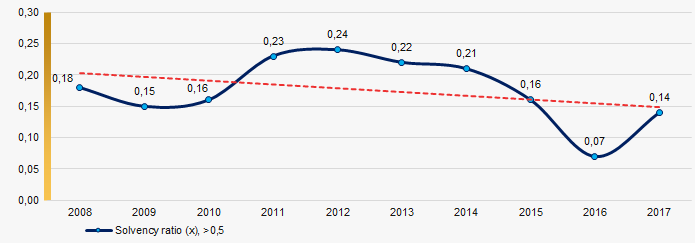 Picture 2. Change in industry average values of the solvency ratio of Russian travel companies in 2008 – 2017