
Order a report
Custom-made industry research, company ratings, competitor analysis


Net profit of shipbuilding enterprises
Information agency Credinform represents a ranking of the largest Russian shipbuilding enterprises. Companies with the largest volume of annual revenue (TOP 10 and TOP 100) were selected for the ranking, according to the data from the Statistical Register and the Federal Tax Service for the latest available periods (2018 - 2020). They were ranked by the net profit ratio (Table 1). The selection and analysis were based on the data of the Information and Analytical system Globas.
Net profit ratio (%) is net profit (loss) to sales revenue. The ratio is indcative of the level of profit on sales.
There is no standard value for this ratio. It is recommended to compare companies of the same industry or to analyse the changes in this ratio for a specified company. Negative value of the ratio shows there is a net loss. High value speaks about the effective operations.
For the most complete and objective view of the financial condition of the enterprise, it is necessary to pay attention to the complex of indicators and financial ratios of the company.
| Name, INN, region | Revenue, million RUB | Net profit (loss), million RUB | Net profit ratio, % | Solvency index Globas | |||
| 2019 | 2020 | 2019 | 2020 | 2019 | 2020 | ||
| 1 | 2 | 3 | 4 | 5 | 6 | 7 | 8 |
| JSC OKSKAYA SHIPYARD INN 5223004199 Nizhniy Novgorod region |
|
|
|
|
|
|
191 High |
| JSC KRASNOE SORMOVO PLANT INN 5263006629 Nizhniy Novgorod region |
|
|
|
|
|
|
195 High |
| JSC UNITED SHIPBUILDING CORPORATION INN 7838395215 Saint Petersburg |
|
|
|
|
|
|
228 Strong |
| JSC SREDNE-NEVSKY SHIPBILDING PLANT INN 7817315385 Saint Petersburg |
|
|
|
|
|
|
206 Strong |
| JSC SHIPBUILDING PLANT SEVERNAYA VERF INN 7805034277 Saint Petersburg |
|
|
|
|
|
|
254 Medium |
| JSC LENINGRAD SHIPYARD PELLA INN 4706000296 Leningrad region |
|
|
|
|
|
|
300 Adequate |
| JSC SHIPYARD YANTAR INN 3900000111 Kaliningrad region |
|
|
|
|
|
|
316 Adequate |
| JSC AMUR SHIPBUILDING PLANT INN 2703000015 Khabarovsk territory |
|
|
|
|
|
|
289 Medium |
| LLC SHIPBUILDING COMPLEX ZVEZDA INN 2503032517 Primorye territory |
|
|
|
|
|
|
313 Adequate |
| JSC BALTIC SHIPYARD INN 7830001910 Saint Petersburg |
|
|
|
|
|
|
269 Medium |
| Average value for TOP 10 | |
|
|
|
|
|
|
| Average value for TOP 100 | |
|
|
|
|
|
|
| Average industry value | |
|
|
|
|
|
|
![]() growth of indicator to the previous period,
growth of indicator to the previous period, ![]() fall of indicator to the previous period
fall of indicator to the previous period
The industry average values of the net profit ratio, as well as the values of TOP 10, were negative in 2020. Five companies decreased their values in 2020, while only three ones did in 2019.
In 2020, six companies gained their revenues, three ones increased net profit and one company reduced its loss.
The revenue of TOP 10 and TOP 100 climbed at average 10% and the industry average figure fell 30%. The loss of TOP 10 and TOP 100 jumped 33%. On average for the industry, there is a 77% increase in the loss.
Over the past five years, the industry average values of the net profit ratio have declined over three periods. The highest value was recorded in 2017 and the lowest one was in 2020 (Picture 1).
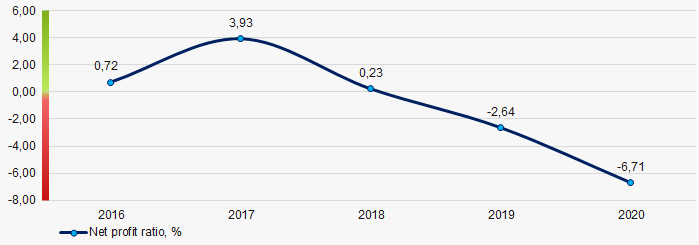 Picture 1. Change in the industry average values of the net profit ratio of shipbuilding enterprises in 2016 - 2020