Order a report
Custom-made industry research, company ratings, competitor analysis


Assets turnover of the largest Russian manufacturers of dairy products
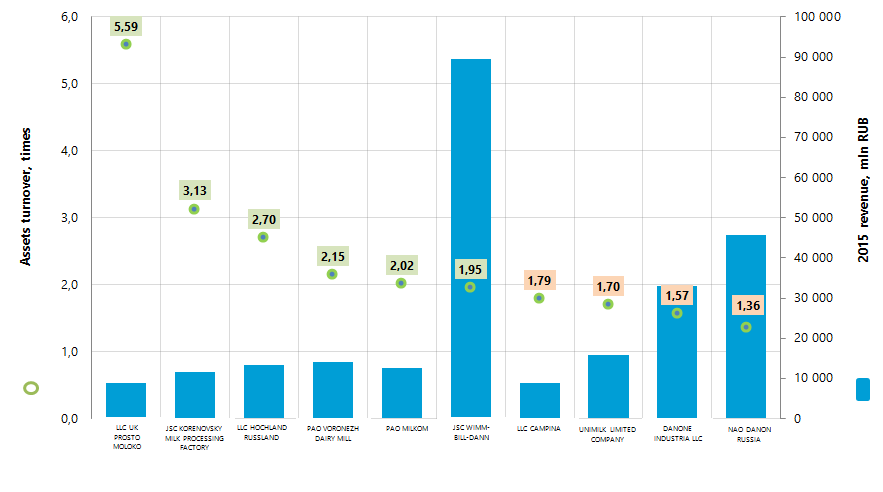
Information Agency Credinform has prepared the ranking of the largest Russian manufacturers of dairy products. The largest enterprises of the industry (TOP-10) in terms of annual revenue were selected according to the data from the Statistical Register for the latest available periods (2015 and 2014). Then the companies were ranged by assets turnover ratio (Table 1).
Assets turnover (times) is the ratio of sales revenue and company’s average total assets for a period. It characterizes the effectiveness of using of all available resources, regardless the source of their attraction. The ratio shows how many times per year the full cycle of production and circulation is performed, generating the corresponding effect in the form of profit.
The calculation of practical values of financial indicators, which might be considered as normal for a certain industry, has been developed and implemented in the Information and Analytical system Globas-i by the experts of Information Agency Credinform, taking into account the actual situation of the economy as a whole and the industries. The practical value of assets turnover ratio for manufacturers of dairy products is more than 1,82 times.
For the most full and fair opinion about company’s financial position not only the compliance with standard values, but the whole set of financial indicators and ratios should be taken into account.
| Name, INN, region | 2015 net profit, mln RUB | 2015 turnover, mln RUB | 2015/2014 revenue, +/- % | 2015 assets turnover, times | Solvency index Globas-i® |
|---|---|---|---|---|---|
| LLC UK PROSTO MOLOKO INN 1660183627 Republic of Tatarstan |
373,0 | 8 856,3 | -12 | 5,59 | 253 High |
| JSC KORENOVSKY MILK PROCESSING FACTORY INN 2335013799 Krasnodar region |
729,0 | 11 481,3 | 26 | 3,13 | 183 The highest |
| LLC HOCHLAND RUSSLAND INN 5040048921 Moscow region |
1 156,8 | 13 304,1 | 15 | 2,70 | 153 The highest |
| PAO VORONEZH DAIRY MILL INN 3662009586 Voronezh region |
699,6 | 13 946,6 | 25 | 2,15 | 189 The highest |
| PAO MILKOM INN 1834100340 Udmurt Republic |
884,4 | 12 480,3 | 16 | 2,02 | 208 High |
| JSC WIMM-BILL-DANN INN 7713085659 Moscow |
6 380,3 | 89 541,9 | 6 | 1,95 | 163 The highest |
| LLC CAMPINA INN 5045021970 Moscow region |
-265,1 | 8 884,5 | -7 | 1,79 | 296 High |
| UNIMILK LIMITED COMPANY INN 7714285185 Moscow |
1 314,6 | 15 699,3 | -65 | 1,70 | 210 High |
| DANONE INDUSTRIA LLC INN 5048005969 Moscow region |
1 489,7 | 33 052,1 | -10 | 1,57 | 243 High |
| NAO DANON RUSSIA INN 7714626332 Moscow |
-1 428,6 | 45 740,1 | 12 | 1,36 | 286 High |
| Total for TOP-10 group of companies (* - average value within group of companies) |
11 333,7 | 252 986,5 | *-6 | *2,40 | |
| Total for TOP-100 group of companies (* - average value within group of companies) |
20 180,8 | 523 778,4 | *6 | *3,08 | |
| Average value within industry | 9,3 | 297,3 | -7 | 1,82 |
In 2015 the average value of the products’ profitability within TOP-10 group of companies is lower than average value within TOP-100 group of companies and higher than average industry value. Meanwhile four companies from TOP-10 list (yellow color in Table 1) have indicators that do not meet practical values.
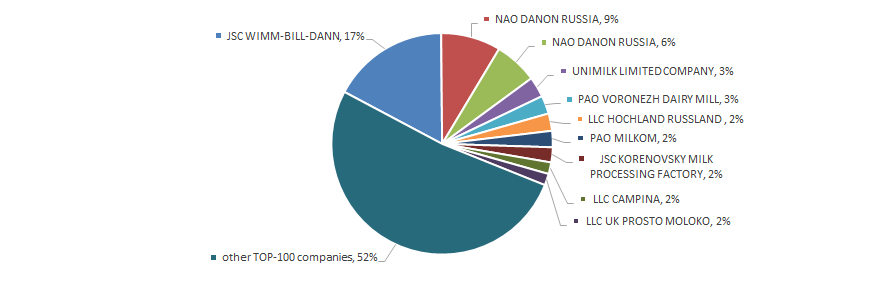
Total revenue of 10 largest companies amounted to 48% from TOP-100 total revenue. This fact testifies rather high level of competition within industry. The shares of the largest companies by 2015 total revenue - JSC WIMM-BILL-DANN and NAO DANON RUSSIA in TOP-100 total revenue amounted to 26% (Picture 2).
All companies from TOP-10 list have the highest or high solvency index Globas-i®, this fact shows the ability of the companies to meet their obligations in time and fully.
In 2015 five companies from TOP-10 have decrease in revenue in comparison with previous period and have loss (red color in Table 1).
In 2014 the TOP-100 list included 11 loss-making companies and in 2015 the number decreased to 5, in other words by 2.2 times.
In general, within 2010-2016 the ratios of dairy products manufacturers in natural terms were unstable; this testifies the data from the Federal State Statistics Service (Table 2).
| 2010 г. | 2011 г. | 2012 г. | 2013 г. | 2014 г. | 2015 г. | 2016 г. | 2016 г. к 2010 г., % | |
|---|---|---|---|---|---|---|---|---|
| Cheese products, tons | 44 979 | 52 132 | 51 981 | 87 040 | 115 792 | 132 907 | 136 237 | 103 |
| Medium-hard cheese, tons | 70 552 | 92 586 | 110 552 | 94 861 | 96 372 | 113 026 | 124 582 | 77 |
| Curd cheese products, tons | 216 739 | 299 250 | 319 996 | 345 753 | 359 855 | 375 284 | 364 539 | 68 |
| Cream, tons | 78 463 | 80 760 | 95 139 | 102 972 | 115 550 | 121 111 | 125 461 | 60 |
| Drinks ready for use and cocktails based on milk and cocoa, tons | 75 739 | 95 088 | 130 733 | 141 366 | 148 866 | 116 535 | 114 199 | 51 |
| Butter milk without food products and food additives, tons | 683 115 | 783 371 | 846 660 | 943 328 | 950 144 | 953 697 | 964 827 | 41 |
| Cheeses and cheese products, tons | 433 376 | 425 359 | 445 467 | 428 613 | 494 319 | 581 315 | 599 687 | 38 |
| Cheese and curd cheese, tons | 1 041 844 | 1 110 245 | 1 170 354 | 1 153 876 | 1 242 956 | 1 375 310 | 1 376 129 | 32 |
| Yogurt without food products and food additives, tons | 100 580 | 102 650 | 126 896 | 124 028 | 125 018 | 127 042 | 125 517 | 25 |
| Sweet creamy butter with mass fraction of fat from 50% to 79 %, tons | 168 607 | 186 783 | 185 743 | 187 955 | 217 062 | 218 968 | 204 919 | 22 |
| Hard pressed cheese, tons | 112 526 | 100 684 | 105 523 | 85 716 | 106 233 | 144 166 | 137 203 | 22 |
| Butter and oil pastes, tons | 206 831 | 217 980 | 215 765 | 221 889 | 253 241 | 260 584 | 250 802 | 21 |
| Butter, tons | 205 152 | 216 274 | 213 579 | 219 843 | 250 783 | 258 930 | 247 413 | 21 |
| Whole-milk products (in recalculation on milk) th tons | 11 295 | 10 576 | 11 254 | 11 563 | 11 445 | 11 626 | 11 855 | 15 |
| Liquid processed milk, tons | 4 870 373 | 4 859 461 | 5 250 812 | 5 345 180 | 5 317 466 | 5 377 867 | 5 490 475 | 13 |
| Sour cream with mass fraction of fat from 15,0% to 34.0 %, tons | 487 445 | 496 524 | 544 421 | 525 157 | 513 883 | 540 059 | 537 567 | 12 |
| Condensed milk products with food products and food additives, th standard cans | 282 811 | 278 790 | 240 948 | 234 443 | 286 171 | 298 565 | 316 790 | 12 |
| Yogurt, tons | 699 820 | 703 469 | 732 221 | 772 308 | 776 911 | 765 539 | 778 847 | 11 |
| Sour cream, tons | 527 479 | 533 486 | 581 064 | 556 456 | 550 318 | 586 635 | 585 760 | 11 |
| Dairy products, tons | 2 258 347 | 2 290 179 | 2 397 347 | 2 505 333 | 2 484 109 | 2 439 741 | 2 479 895 | 10 |
| Yogurt and other milk or cream fermented or acidified, tons | 2 829 213 | 2 839 254 | 2 995 885 | 3 077 586 | 3 052 499 | 3 045 407 | 3 088 109 | 9 |
| Milk and cream in solid forms, tons | 109 679 | 132 527 | 123 806 | 116 183 | 147 708 | 127 298 | 117 819 | 7 |
| Butter milk, tons | 1 008 791 | 1 030 457 | 1 063 976 | 1 095 465 | 1 082 751 | 1 067 573 | 1 068 050 | 6 |
| Ryazhenka, tons | 208 081 | 212 947 | 224 114 | 223 768 | 216 156 | 217 207 | 221 291 | 6 |
| Fermented milk products, fermented heat-treated products, tons | 172 552 | 168 556 | 186 142 | 199 981 | 164 219 | 163 383 | 182 967 | 6 |
| Ice cream and other frozen desserts, tons | 387 416 | 334 712 | 364 154 | 369 458 | 377 739 | 375 429 | 407 114 | 5 |
| Curd cheese, tons | 387 372 | 381 037 | 397 310 | 372 177 | 382 571 | 413 341 | 405 148 | 5 |
| Condensed milk products, th standard cans | 880 014 | 853 492 | 861 000 | 859 885 | 830 091 | 828 570 | 847 009 | -4 |
| Condensed milk, th standard cans | 589 648 | 570 727 | 617 145 | 621 104 | 540 140 | 525 944 | 526 954 | -11 |
| Cream cheese, tons | 146 813 | 123 190 | 115 075 | 94 533 | 99 607 | 102 876 | 106 171 | -28 |
*) Red color in table 2 shows decline in production, green color shows the growth.
Within 2010-2016 production of cheese and curd cheese products, as well as cream grew was ramping up at the fastest rates. Production of condensed milk and cream cheese within this period decreased.
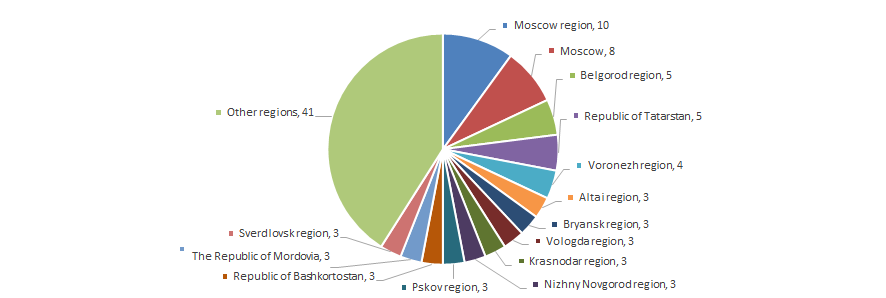
Manufacturers of dairy products are relatively equally distributed across the country with a slight predominance in the densely populated Moscow region. This fact is confirmed by data from the Information and Analytical system Globas-i, according to which 100 largest companies of the industry in terms of 2015 revenue are registered in 43 Russian regions (Picture 4).