Order a report
Custom-made industry research, company ratings, competitor analysis


Product profitability of the largest pharmaceutical companies and medicine products manufacturers in Russia
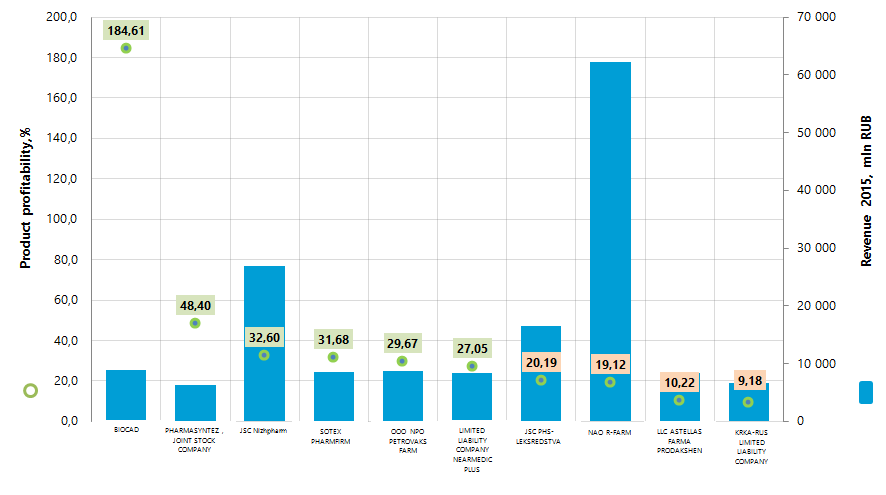
Information agency Credinform has prepared the ranking of the largest pharmaceutical companies and medicine products manufacturers in Russia on product profitability ratio. Companies having the largest annual revenue in the industry (TOP-10) for the last available in the Statistical register period (2015 and 2014) were taken for the ranking. Further they were ranked on the product profitability value (Table 1).
Product profitability is calculated as a ratio of profit on sales to operational expenses. In the whole, the profitability reflects the production efficiency. The analysis of product profitability allows making a conclusion on release usefulness of various products. There aren’t any recommended values for this group, due to the fact that they differ greatly depending on industry.
Taking into account both the current situation in the economy in whole and in industries, the experts of the Information agency Credinformworked out and implemented in the Information and Analytical system Globas-i the calculation of the practical importance of financial ratios which may be considered standard for the specific industry. The practical importance of product profitability for pharmaceutical companies amounts to more than 21,9%.
In order to get the full and fair picture of the company’s financial situation, it is necessary to pay attention not only to compatibility with standard values, but also to all the available combination of financial indicators and ratios.
| Name, tax number, region | Net profit (loss) 2015, mln RUB | Revenue 2015, mln RUB | Revenue 2015, to 2014, +/- % | Product profitability, % | Solvency index Globas-i® |
|---|---|---|---|---|---|
| BIOCAD Tax number 5024048000 Saint-Petersburg |
4 349,5 | 8 914,2 | 6,3 | 184,61 | 163 Prime |
| PHARMASYNTEZ, JOINT STOCK COMPANY Tax number 3810023308 Irkutsk region |
294,6 | 6 343,6 | 63,6 | 48,40 | 201 High |
| JSC Nizhpharm Tax number 5260900010 Nizhny Novgorod region |
2 139,6 | 26 813,0 | 28,1 | 32,60 | 213 High |
| SOTEX PHARMFIRM Tax number 7715240941 Moscow region |
1 203,0 | 8 560,6 | 29,1 | 31,68 | 178 Prime |
| OOO NPO PETROVAKS FARM Tax number 7702302492 Moscow region |
1 454,0 | 8 696,6 | 19,0 | 29,67 | 203 High |
| LIMITED LIABILITY COMPANY NEARMEDIC PLUS Tax number 7734247100 Moscow |
26,2 | 8 357,6 | 27,8 | 27,05 | 221 High |
| JSC PHS-LEKSREDSTVA Tax number 4631002737 Kursk region |
3 995,8 | 16 426,9 | 43,1 | 20,19 | 152 Prime |
| NAO R-FARM Tax number 7726311464 Moscow |
8 608,0 | 62 204,0 | 11,2 | 19,12 | 171 Prime |
| LLC ASTELLAS FARMA PRODAKSHEN Tax number 7709948951 Moscow |
184,7 | 8 354,6 | 3 380,8 | 10,22 | 254 High |
| KRKA-RUS LIMITED LIABILITY COMPANY Tax number 5017036276 Moscow region |
312,5 | 6 709,9 | 27,4 | 9,18 | 257 High |
| Total for TOP-10 group of companies (* - group of companies average value) |
22 567,9 | 161 381,0 | *27,5 | *41,27 | |
| Total for TOP-100 group of companies (* - group of companies average value) |
34 460,8 | 274 612,4 | *24,1 | *32,19 | |
| Industry average value | 37,5 | 360,7 | 7,8 | 21,90 |
СThe average value of product profitability in the group of companies TOP-10 in 2015 is notably higher than in TOP-100 group and than the industry-average value. At the same time, four companies of the TOP-10 (highlighted with the yellow shading in the Table 1) do not conform to the practical importance.
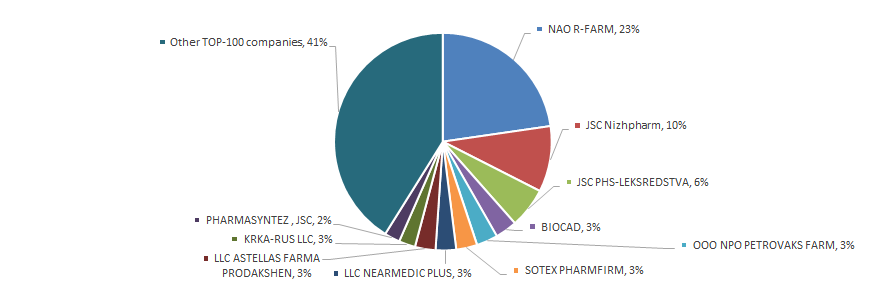
The revenue volume of the 10 largest companies amounts to 59% of the total revenue of 100 largest companies. It gives evidence to high monopolization rate in this industry. The shares of the companies largest by the revenue volume in 2015 – NAO R-FARM and JSC Nizhpharm amounted to 33% in the total revenue of the TOP-100 group of companies (Figure 2).
All of the TOP-10 companies were given the Prime and High solvency index Globas-i®, which bears evidence to their ability to meet debt obligations timely and full.
Three companies of the TOP-10 significantly decreased their net profit in 2015 (highlighted with the red shading in the Table 1), considering the fact that revenue volume of all companies increased comparing to the previous period.
In 2014 there were 18 loss-making companies in the TOP-100 group of companies and in 2015 this number decreased to 7, i.e. by a factor of 2,5.
In whole, the indicators of manufacture of pharmaceutical and other products for medicine in volume terms over the 2010 to 2016 period aren’t stable, which is confirmed by the data of the Federal State Statistics Service (Rosstat) (Table 2).
| Indicators and types of products | Unit measure | 2010 | 2011 | 2012 | 2013 | 2014 | 2015 | 2016 | 2016 to 2010, % |
|---|---|---|---|---|---|---|---|---|---|
| Diagnostic reagents, filling materials for dental surgery, materials for neogenesis and repair of bone tissues and other pharmaceutical products | Thousand units | 212 | 175 | 2 365 | 3 532 | 3 318 | 4 138 | 4 719 | 2 126 |
| Diabetes mellitus drugs | Thousand flasks | 435 | 471 | 419 | 3 590 | 13 781 | 16 845 | 8 015 | 1 742 |
| Absorbent cotton, cheesecloth and similar items, steeped in or covered by pharmaceuticals or packed in forms or units for retail sale | Thousand units | 21 124 | 153 587 | 197 798 | 249 808 | 303 127 | 304 226 | 251 918 | 1 093 |
| Pharmaceuticals, comprising hormones, but not comprising antibiotics | Thousand cartridges | 1 649 | 4 891 | 5 616 | 8 396 | 10 590 | 13 918 | 7 564 | 359 |
| Serosity and immune vaccines | Thousand cartridges | 11 490 | 16 807 | 14 418 | 18 015 | 28 185 | 25 957 | 33 811 | 194 |
| Pharmaceuticals | mln RUB | 127 293 | 142 551 | 169 152 | 191 699 | 185 382 | 231 031 | 285 870 | 125 |
| Oral and teeth hygiene products (including toothpastes and toothpowder for dental prosthesis), flosses for tooth brushing | Thousand pieces | 270 213 | 267 268 | 280 248 | 292 443 | 254 883 | 262 875 | 313 409 | 16 |
| Pharmaceuticals, comprising alkaloids or its derivatives, but not comprising hormones or antibiotics; other pharmaceuticals | Thousand cartridges | 480 470 | 523 453 | 491 109 | 471 499 | 461 087 | 563 528 | 536 963 | 12 |
| Medicines preparations to treat ophthalmic diseases | Thousand units | 52 934 | 55 172 | 55 133 | 40 077 | 47 945 | 60 004 | 58 759 | 11 |
| Special sterile single-use surgical products made of nonwoven fabrics for protection of patient and medical personnel | Thousand units | 26 845 | 9 290 | 28 127 | 21 332 | 21 552 | 20 066 | 29 463 | 10 |
| Medicines preparations to treat dysbacteriosis, th dosages | Thousand dosages | 502 858 | 456 673 | 464 762 | 474 315 | 426 123 | 451 049 | 460 839 | -8 |
| Medical injectors of multi and single use with or without injection needle | Thousand pieces | 1 005 860 | 722 199 | 625 765 | 576 546 | 581 953 | 867 068 | 908 061 | -10 |
| Medicines preparations to treat diseases of the endocrine system, organs digestive system and other diseases | Thousand cartridges | 118 092 | 114 876 | 128 577 | 91 526 | 110 821 | 98 539 | 101 697 | -14 |
| Vitamin products | Thousand cartridges | 237 030 | 276 329 | 221 330 | 167 033 | 174 982 | 233 537 | 192 942 | -19 |
| Analgetic, antipyretic and anti-inflammatory agents | Thousand cartridges | 427 511 | 345 062 | 366 446 | 346 959 | 328 291 | 406 991 | 321 143 | -25 |
| Antibiotics | Ton | 85 | 14 | 57 | 32 | 49 | 69 | 57 | -33 |
| Pharmaceuticals, comprising penicillin or other antibiotics | Thousand cartridges | 20 980 | 18 068 | 13 008 | 17 560 | 13 732 | 19 175 | 12 822 | -39 |
| Medicines preparations to treat cardiovascular diseases | Thousand cartridges | 237 899 | 278 646 | 258 523 | 231 473 | 177 553 | 160 641 | 140 603 | -41 |
| Medicines preparations to treat psychoneurological diseases | Thousand cartridges | 70 724 | 84 485 | 80 670 | 55 874 | 38 804 | 39 961 | 37 323 | -47 |
| Preparations used in obstetric-gynecologic matters | Thousand cartridges | 17 397 | 19 523 | 13 075 | 16 958 | 11 196 | 15 244 | 8 518 | -51 |
| Sterile surgical materials for adesmosis | Thousand units | 2 694 | 1 352 | 1 770 | 1 914 | 872 | 694 | 1 277 | -53 |
| First aid boxes and medicine bags | Thousand pieces | 4 417 | 2 537 | 2 440 | 1 853 | 1 704 | 1 542 | 2 046 | -54 |
| Preparations for general and local anesthesia | Thousand cartridges | 147 826 | 129 171 | 81 442 | 98 236 | 53 258 | 46 150 | 55 503 | -62 |
| Preparations to treat oncological diseases | Thousand flasks | 799 | 2 064 | 3 084 | 1 239 | 941 | 4 684 | 217 | -73 |
| Antituberculotics | Thousand cartridges | 10 437 | 6 938 | 6 894 | 2 193 | 7 256 | 3 801 | 2 298 | -78 |
*) In Table 2, the decline in production is highlighted with the red shading, the growth – with the green one.
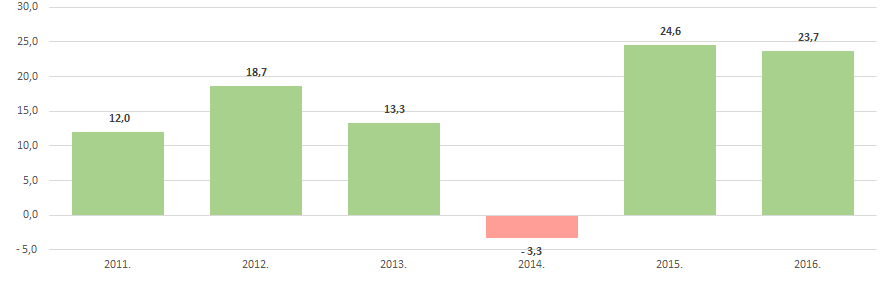
Manufacture of pharmaceuticals in monetary terms in the corresponding period in whole were growing, having the exceptionally fast pace in 2015 and 2016 (Figure 3).
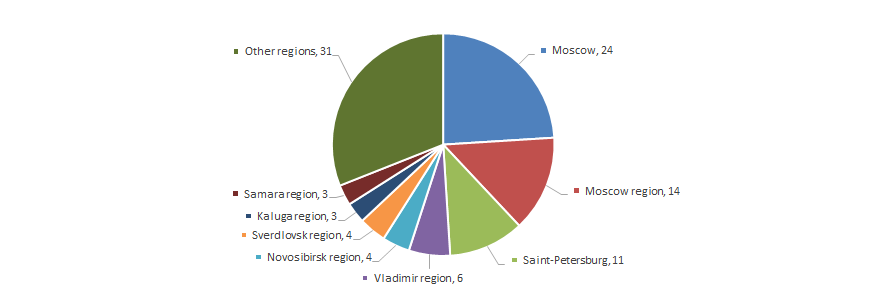
Enterprises manufacturing pharmaceutical and other products for medicine are distributed in an uneven manner within country’s regions and generally gravitate to the developed industrial centers, having the infrastructure for high-tech manufacture. It is confirmed by the data of the Information and Analytical system Globas-i, according to which 100 companies industry-largest by the revenue volume for 2015 are registered in 35 regions of Russia (Figure 4).