
Order a report
Custom-made industry research, company ratings, competitor analysis


The profit level of the lottery companies
Information agency Credinform has prepared a ranking of the largest Russian lottery companies. The largest enterprises (TOP-10) in terms of annual revenue were selected according to the data from the Statistical Register and the Federal Tax Service for the available periods (2017-2019). Then the companies were ranged by net profit ratio (Table 1). The analysis was based on the data from the Information and Analytical system Globas.
Net profit ratio (%) is calculated as a ratio of net profit (loss) to sales revenue. The ratio reflects the company’s level of sales profit.
The ratio doesn’t have the standard value. It is recommended to compare the companies within the industry or the change of a ratio in time for a certain company. The negative value of the ratio indicates about net loss. The higher is the ratio value, the better the company operates.
For the most full and fair opinion about the company’s financial position the whole set of financial indicators and ratios should be taken into account.
| Name, INN, region | Revenue, million RUB | Net profit (loss), million RUB | Net profit ratio, % | Solvency index Globas | |||
| 2018 | 2019 | 2018 | 2019 | 2018 | 2019 | ||
| 1 | 2 | 3 | 4 | 5 | 6 | 7 | 8 |
| JSC STATE SPORT LOTTERIES INN 7728795958 Krasnodar region |
|
|
|
|
|
|
180 High |
| JSC TK TSENTR INN 7715918994 Sverdlovsk region |
|
|
|
|
|
|
212 Strong |
| LLC SPORTLOTTO INN 7743771091 Volgograd region |
|
|
|
|
|
|
214 Strong |
| JSC LOTTERIES OF MOSCOW INN 7715215381 Chelyabinsk region |
|
|
|
|
|
|
237 Strong |
| LLC LOTO-SERVICE INN 0274075431 Moscow |
|
|
|
|
|
|
255 Medium |
| JSC KUBANLOTO INN 2309020380 Moscow |
|
|
|
|
|
|
260 Medium |
| LLC VSE LOTO INN 7743783273 Moscow |
|
|
|
|
|
|
243 Strong |
| LLC URAL LOTO INN 7447081901 Republic of Bashkortostan |
|
|
|
|
|
|
262 Medium |
| LLC VOLGOGRAD SPORT LOTTERIES INN 3444099477 Moscow |
|
|
|
|
|
|
283 Medium |
| LLC LOTEKA INN 6670287952 Moscow |
|
|
|
|
|
|
287 Medium |
| Average value for TOP-10 companies | |
|
|
|
|
|
|
| Average industry value | |
|
|
|
|
|
|
![]() growth of indicator in comparison with prior period,
growth of indicator in comparison with prior period, ![]() decline of indicator in comparison with prior period
decline of indicator in comparison with prior period
The average value of net profit ratio for TOP-10 companies is higher than average industry value: in 2019, six companies improved the results.
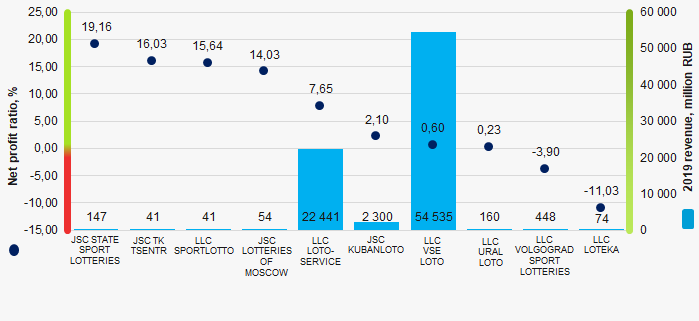 Picture 1. Net profit ratio and revenue of the largest Russian lottery companies (ТОP-10)
 Within 10 years, the average industry indicators of net profit ratio showed the growing tendency. (Picture 2).
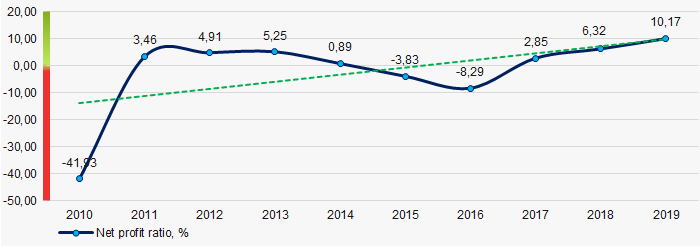 Picture 2. Change in average industry values of net profit ratio of Russian lottery companies in 2010 – 2019