Order a report
Custom-made industry research, company ratings, competitor analysis


Net profit ratio of the largest manufacturers of aviation equipment
Information agency Credinform presents a ranking of the largest manufacturers of aviation equipment in terms of net profit ratio.
The largest Russian enterprises (TOP-10) with the highest volume of revenue were selected for this ranking according to the data from the Statistical Register for the latest available period (2015). These enterprises were ranked by decrease in net profit ratio. (Table 1).
Net profit ratio (%) is calculated as the ratio of net profit (loss) to sales revenue. The ratio shows sales profit rate of companies.
There is no prescribed value. It is advisable to compare companies within one industry or analyze change of ratio in time on particular enterprise.
Negative value of an indicator shows that there is net loss. Higher value reflects high efficiency of enterprise operation.
For the most full and fair opinion about the company’s financial position the whole set of financial indicators and ratios should be taken into account.
| Name, INN, region | Net profit of 2015, mln RUB | Revenue of 2015, mln RUB | Revenue of 2015 to 2014, (+/- %) | Net profit ratio, % | Solvency index Globas-i |
|---|---|---|---|---|---|
| SPB OAO KRASNYI OKTYABR INN 7830002462 Saint-Petersburg |
2 201,0 | 7 772,8 | 16,2 | 28,32 | 136 The highest |
| JOINT STOCK COMPANY HYDROMASH INN 5262008630 Nizhny Novgorod region |
480,4 | 5 409,3 | 13,9 | 8,88 | 177 The highest |
| UMPO JOINT STOCK COMPANY INN 0273008320 The Republic of Bashkortostan |
3 577,3 | 67 511,0 | 38,1 | 5,30 | 199 The highest |
| JOINT STOCK COMPANY KLIMOV INN 7802375335 Saint-Petersburg |
484,0 | 15 211,8 | 53,8 | 3,18 | 200 High |
| Joint-stock Company United Engine Corporation INN 7731644035 Moscow |
434,8 | 28 027,9 | 25,5 | 1,55 | 232 High |
| JOINT STOCK COMPANY PERM ENGINE COMPANY INN 5904007312 Perm territory |
63,9 | 20 699,2 | 3,3 | 0,31 | 226 High |
| NPO SATURN JOINT STOCK COMPANY INN 7610052644 Yaroslavl region |
-2 287,4 | 24 039,0 | 33,1 | -9,52 | 264 High |
| JOINT STOCK COMPANY KUZNETSOV INN 6319033379 Samara region |
-1 036,8 | 10 267,6 | 2,1 | -10,10 | 282 High |
| JOINT STOCK COMPANY SUKHOI CIVIL AIRCRAFT INN 7714175986 Moscow |
-10 788,0 | 35 396,7 | 21,9 | -30,48 | 270 High |
| AO MMP NAMED AFTER V.V. CHERNYSHEV INN 7733018650 Moscow |
-10 890,7 | 10 055,1 | 40,4 | -108,31 | 281 High |
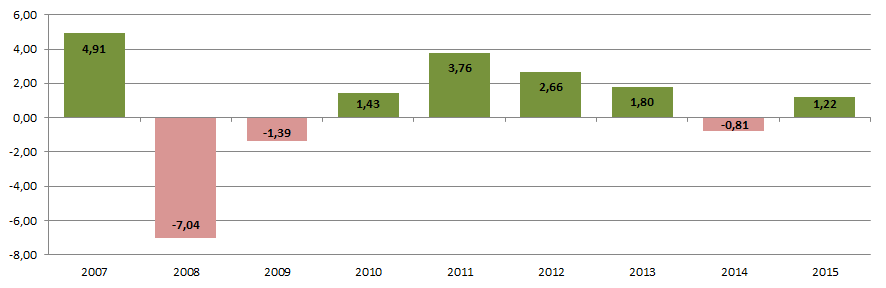
The average net profit ratio among TOP-10 companies in 2015 is marked with negative value and is equal to -11,8. The same indicator among TOP-30 companies is 0,22, at industry average value of 1,22. Besides, dynamics of industry average values (Picture 1) has reference to the macroeconomic situation, while enterprises of the industry to a large extent use the Government assistance.
All of TOP-10 companies have got the highest and high solvency index Globas-i that shows their ability to pay off the debts in time and to the full extent.
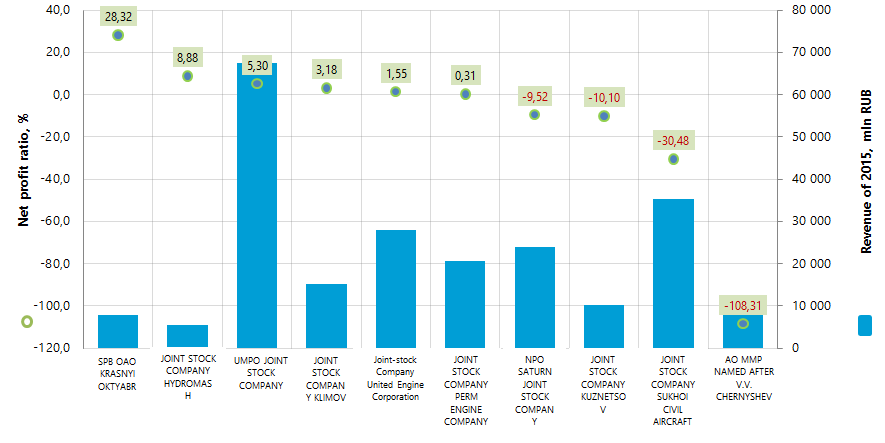
Total revenue of TOP-10 companies in 2015 was 224,4 bln RUB that is 27% more than in 2014. Besides, total net loss in this group decreased by 15 %. Seven companies of TOP-10 (marked with red colour in Table 1) have got decrease in net profit values or loss at year-end 2015 compared to the previous period.
In the TOP-30 group increase in revenue for the same period was 23%, with decrease in total net loss by 21%.
Six companies of TOP-10, as in the industry in general, are observed to have positive values of net profit ratio. On the back of economic turbulence, the industry has positive prospects for further development, taking into account constant support from the Government. This is confirmed by estimated indicators of increase in flying vehicles sales revenue (Picture 3), based on data of the Federal State Statistics Service.
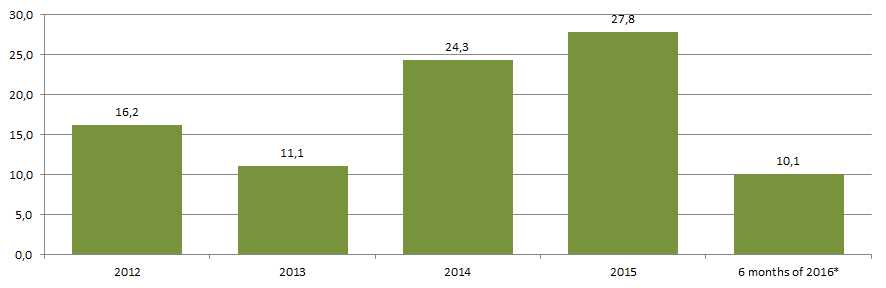
*) – data for 6 months of 2016 are given to the corresponding period of 2015.
Manufacture of aviation equipment is significantly attracted to regions with prominent productive and scientific potential – Moscow and Moscow region, Saint-Petersburg, Nizhny Novgorod and Samara regions. This is confirmed by data of the Information and analytical system Globas-i, according to that 30 largest enterprise of the industry in terms of revenue volume for 2015 are concentrated in 12 regions of Russia (Picture 4).