
Order a report
Custom-made industry research, company ratings, competitor analysis

Leverage ratio of the largest Russian manufacturers of detergents, perfumery and cosmetics
Information agency Credinform has prepared a ranking of the largest Russian manufacturers of detergents, perfumery and cosmetics. The enterprises with the largest volume of annual revenue (TOP-10) have been selected for the ranking, according to the data from the Statistical Register for the latest available accounting periods (2016 and 2015). Then they have been ranked by leverage ratio (Table 1). The analysis was based on the data from the Information and Analytical system Globas.
Leverage ratio (or a ratio of debt and equity) is one of one of financial stability ratios. These ratios demonstrate potential opportunity of granting of long-term loans or investment, as they assess the company’s ability to meet its long-term obligations. Leverage ratio (Lr) is a ratio of total debt to total equity, and it indicates the number of units of company’s borrowings for every unit of its own source of financing.
Its recommended value is from 0 to 1. The ratio of debt and equity should not be negative, so a ratio value within the limit is one of the indicators that the company is able to meet its obligations.
A calculation of practical values of financial ratios, which might be considered as normal for a certain industry, has been developed and implemented in the Information and Analytical system Globas by the experts of the Information Agency Credinform, having taken into account the current situation in the economy as a whole and in the industries. The practical value of leverage ratio for manufacturers of detergents, perfumery and cosmetics amounted from 0 to 5,55 in 2015.
The whole set of financial indicators and ratios of a company is to be considered to get the fullest and fairest opinion about the company’s financial standing.
| Name, INN, region | Net profit, mln RUB | Revenue, mln RUB | Leverage ratio (Lr 0≤(x)<1) | Solvency index Globas | |||
| 2015 | 2016 | 2015 | 2016 | 2015 | 2016 | ||
| NPJSC NEVSKAYA COSMETICA INN 7811038047 Saint Petersburg |
3 007,0 | 3 083,9 | 12 737,6 | 13 548,7 | 0,10 | 0,07 | 148 Superior |
| PROCTER AND GAMBLE NOVOMOSKOVSK LLC INN 7101006354 Tula region |
-208,3 | 2 345,8 | 29 655,4 | 35 903,5 | 0,60 | 0,56 | 212 High |
| RECKITT BENCKISER LLC INN 7705495411 Moscow |
714,6 | 1 142,2 | 20 452,3 | 20 191,9 | 0,86 | 0,65 | 191 Superior |
| FABERLIC PJSC INN 5001026970 Moscow |
3 097,5 | 1 823,2 | 12 782,4 | 20 616,9 | 0,59 | 0,88 | 186 Superior |
| HENKEL RUS LLC INN 7702691545 Moscow |
5 745,9 | 5 122,2 | 57 133,1 | 63 682,9 | 1,39 | 0,91 | 196 Superior |
| L'OREAL NPJSC INN 7726059896 Moscow |
2 001,8 | 3 323,1 | 42 395,4 | 48 503,5 | 1,19 | 1,21 | 173 Superior |
| ARNEST NPJSC INN 2631006752 Stavropol terrirory |
567,7 | 600,4 | 6 913,5 | 8 895,1 | 1,30 | 1,24 | 180 Superior |
| NEFIS COSMETICS NPJSC - Kazan Chemical Plant named after M. Vakhitov (Soap and Candle Plant #1 of former Krestovnikovs) INN 1653005126 Republic of Tatarstan |
139,1 | 777,6 | 12 882,6 | 18 048,4 | 3,88 | 2,79 | 208 High |
| NTS GRADIENT LLC INN 7720125736 Moscow |
77,4 | 169,7 | 14 163,1 | 16 078,8 | 13,93 | 9,58 | 228 High |
| SK-VELAN NPJSC INN 7715503132 Moscow region |
6,9 | 6,9 | 99,6 | 8 468,5 | 2,35 | 51,24 | 231 High |
| Total for TOP-10 companies | 15 149,4 | 18 394,9 | 209 215,0 | 253 938,1 | |||
| Average value of TOP-10 companies | 1 514,9 | 1 839,5 | 20 921,5 | 25 393,8 | 2,62 | 6,91 | |
| Industry average value | 16,8 | 249,0 | 1,12 | ||||
Leverage ratio of TOP-10 companies is higher than the average industry value. Five companies of TOP-10 have a ratio value within the recommended figures, three companies have index value within the practical value, and two companies have a value above the limit of recommended value (green, orange and red colors respectively in columns 6 and 7 of Table 1 and Picture 1). Three of TOP-10 companies have a decrease in revenue or net profit as compared to the prior period (red highlight in columns 3 and 5 of Table 1).
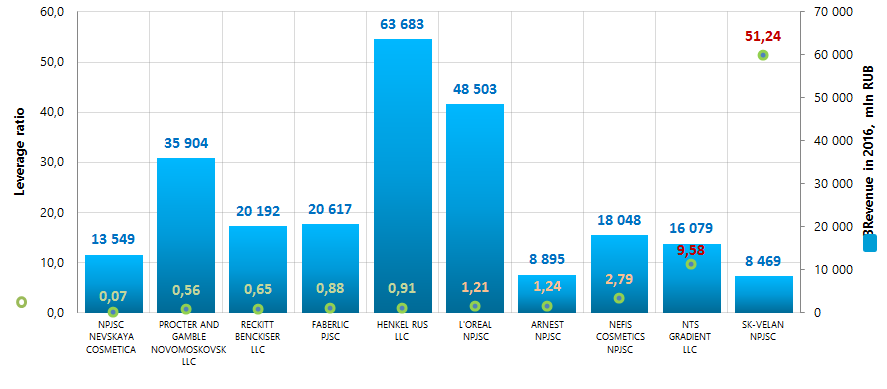 Picture 1. Leverage ratio and revenue of the largest Russian manufacturers of detergents, perfumery and cosmetics (TOP-10)
Industry average values of leverage ratio in 2006-2015 are within the recommended and practical value (Picture 2). This represents the companies of the sector as financially stable and investment attractive ones.
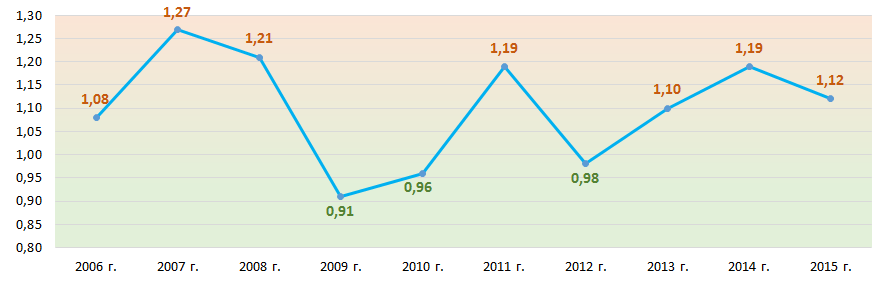 Picture 2. Change of industry average values of leverage ratio of Russian manufacturers of detergents, perfumery and cosmetics in 2006-2015
All TOP-10 companies have got a superior or a high solvency index Globas, that indicates their ability to meet debt obligations timely and in full.