
Order a report
Custom-made industry research, company ratings, competitor analysis


Provision of loans trends
Information agency Credinform presents a review of activity trends of the largest companies in the sphere of loans provision.
The largest companies (TOP-1000), engaged in consumer lending, international trade financing, providing cash loans, pawnshop services, etc, were selected for the analysis according to the data from the Statistical Register and the Federal Tax Service for the latest available accounting periods (2011 – 2020). The selection of companies and the analysis were based on the data from the Information and Analytical system Globas.
Net assets are total assets less total liabilities. This indicator reflects the real value of the property of an enterprise. When the company’s debt exceeds the value of its property, the indicator is considered negative (insufficiency of property).
The largest company in the industry in terms of net assets is NAO CENTRAL FUEL COMPANY, INN 7709221179, Moscow, provision of loans and other types of credit. In 2020, net assets amounted to over 28 billion RUB.
ARDIAY INVEST LLC had the smallest amount of net assets in the TOP 1000, INN 7751000769, Moscow region, provision of loans and other types of credit. Property insufficiency in 2020 was expressed by a negative value of -342 million RUB.
Covering the ten-year period, average net assets of the industry and their growth rates have an upward trend (Picture 1).
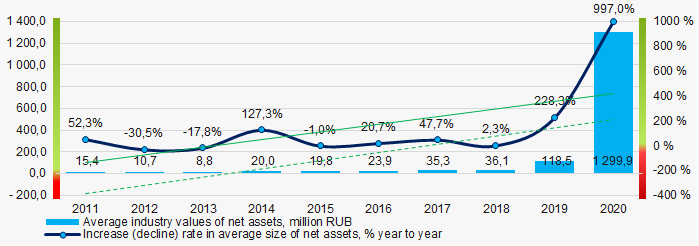 Picture 1. Change in average industry net assets ratios in 2011-2020
Shares of companies with property insufficiency in the TOP 1000 had a positive downward trend over the past five years (Picture 2).
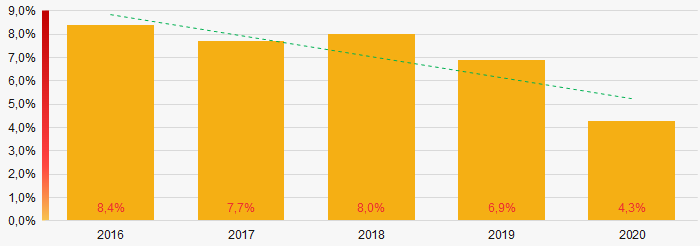 Picture 2. Shares of the TOP 1000 companies with negative net assets in 2016-2020
Sales revenue
The revenue of the TOP 10 companies in 2020 amounted to almost 52% of the total revenue of the TOP 1000 companies. (Picture 3). This indicates a high level of monopolization in the industry.
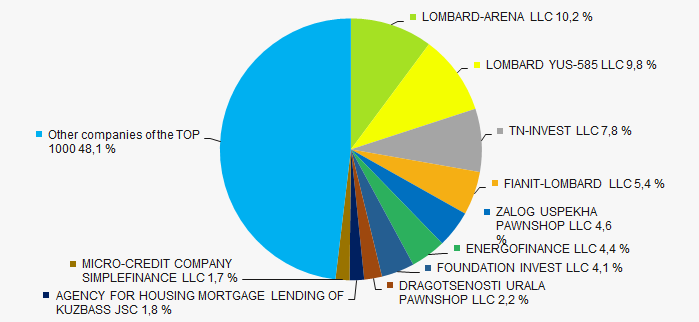 Picture 3. Shares of the TOP 10 companies in the total revenue 2020 of TOP 1000
In general, there is a trend in revenue increasing and growth rates decreasing. (Picture 4).
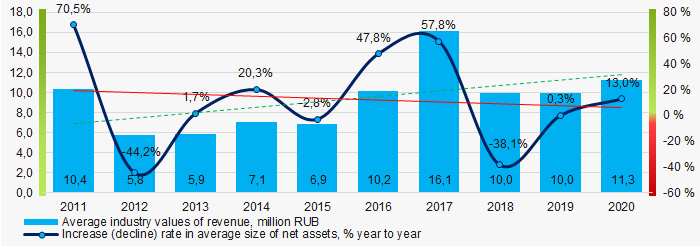 Picture 4. Change in average industry revenue values in 2011-2020
Profit and loss
The largest company in the TOP 1000 in terms of net profit in 2020 is AQUA-CAPITAL LLC, INN 7825123775, Saint Petersburg, provision of loans and other types of credit. The profit amounted to over 5 billion RUB.
Covering the ten-year period, indicators of average industry profit margins tend to increase. (Pictures 5).
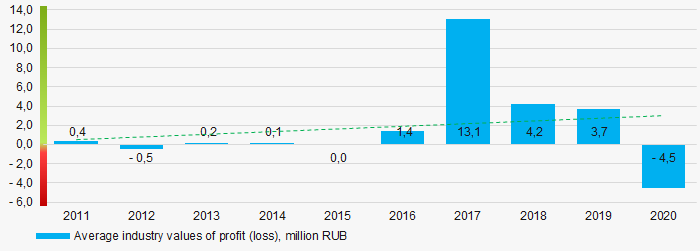 Picture 5. Change in average profit (loss) ratios of the TOP 1000 in 2011-2020
Covering the five-year period, average values of net profit of the TOP 1000 companies are increasing, while average net loss is also growing (Picture 6).
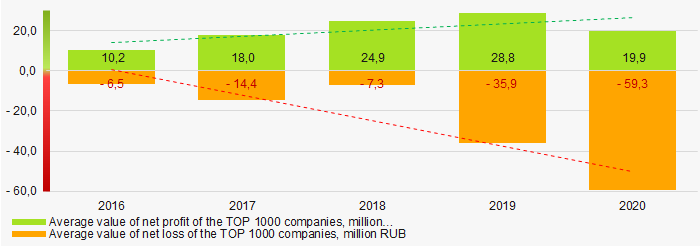 Picture 6. Change in average values of net profit and net loss ratios of the TOP 1000 companies in 2016-2020
Key financial ratios
Covering the ten-year period, average industry indicators of the total liquidity ratio were mainly in the range of recommended values - from 1.0 to 2.0, with an upward trend. (Figure 7).
Total liquidity ratio (current assets to short-term liabilities) shows sufficiency of a company’s assets to settle short-term liabilities.
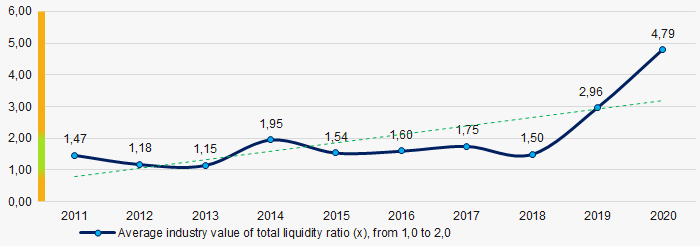 Picture 7. Change in average values of total liquidity ratio in 2011-2020
For the ten years period, average values of return on investment ratio showed a tendency to increase (Picture 8).
ROI ratio is calculated as net profit to sum of shareholders equity and long-term liabilities, and shows the return of equity involved in commercial activities and long-term borrowed funds.
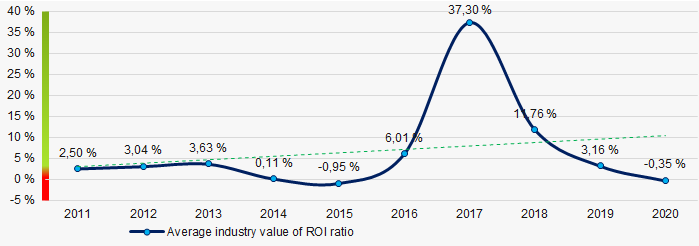 Picture 8. Change in ROI average values in 2011-2020
Asset turnover ratio is calculated as ratio of sales revenue to average value of total assets for a period and implicates the efficiency of use of all available resources, regardless of the sources they were raised. The ratio shows how many times per year the full cycle of production and turnover is performed generating the corresponding effect in the form of profit.
Covering the ten years period, values of the said business activity ratio showed a trend to decrease (Picture 9).
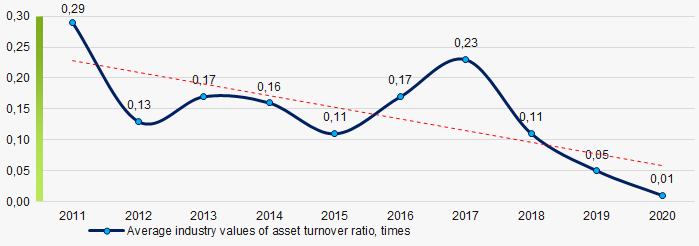 Picture 9. Change in average values of asset turnover ratio in 2011-2020
Small enterprises
94% of the TOP 1000 companies are registered in the Unified Register of Small and Medium-sized Businesses of the Federal Tax Service of the Russian Federation. At the same time, the share of their revenue in the total volume of the TOP 1000 in 2020 is almost 55%, which is almost three times higher than the national average in 2018-2019. (Figure 10).
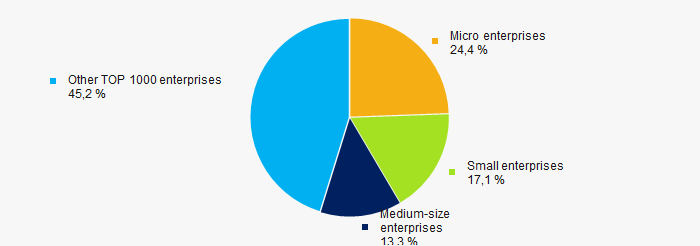 Picture 10. Revenue shares of small and medium-sized enterprises in the TOP-1000
Main regions of activity
The TOP 1000 companies are registered in 78 regions (92% of the subjects of the Russian Federation) and are distributed unevenly across the country. More than 51% of the total revenue of the TOP 1000 companies in 2020 is concentrated in Moscow, St. Petersburg and the Novosibirsk region (Picture 11).
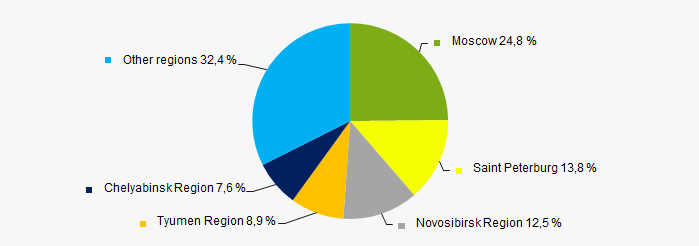 Picture 11. Distribution of the TOP 1000 companies' revenue by Russian regions
Financial position score
Financial position assessment of the TOP 1000 companies shows that the largest part of them is in average financial position. (Picture 12).
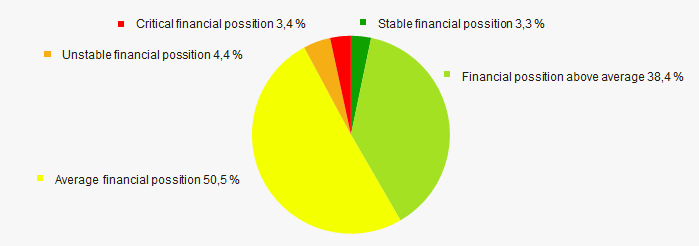 Picture 12. Distribution of the TOP 1000 companies by financial position score
Globas Solvency Globas
The largest part of the TOP-1000 companies has been assigned an Adequate/Weak GlobasSolvency Index. This indicates that they cannot fully meet their debt obligations (Picture 13).
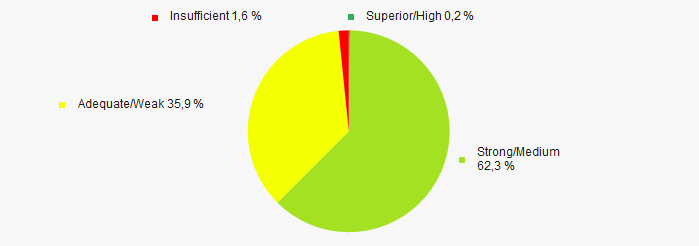 Picture 13. Distribution of the TOP 1000 companies according to the Globas Solvency Index
Conclusion
Comprehensive assessment of activities of the largest companies providing loans, that takes into account main indexes, financial indicators and ratios, indicates predominance of positive trends in their activities in the period from 2012 to 2020. (Table 1).
| Trends and evaluation factors | Share of factor, % |
| Dynamics of average net assets value | |
| Increase (decline) rate in average size of net assets | |
| Increase / decrease in share of enterprises with negative values of net assets | |
| Level of monopolization / competition | |
| Dynamics of average revenue value | |
| Increase (decline) rate in the average size of revenue | |
| Dynamics of average profit (loss) | |
| Increase / decline in average values of net profit | |
| Increase / decline in average values of net loss | |
| Increase / decrease in average values of total liquidity ratio | |
| Increase / decrease in average values of return on investment ratio | |
| Increase / decrease in average values of asset turnover ratio, times | |
| Share of small and medium-sized businesses in terms of revenue exceeding 20% | |
| Regional concentration | |
| Financial position (the largest share) | |
| Globas Solvency Index (the largest share) | |
| Average value of factors share | |
![]() positive trend (factor),
positive trend (factor), ![]() negative trend (factor)
negative trend (factor)