
Order a report
Custom-made industry research, company ratings, competitor analysis


Trends in activity of the largest Russian companies engaged in processing and conservation of fish, crustaceans and mollusks
Information agency Credinform has prepared a review of trends in activity of the largest Russian companies engaged in processing and conservation of fish, crustaceans and mollusks.
The largest enterprises (TOP-10 and TOP-1000) in terms of annual revenue were selected according to the data from the Statistical Register for the latest available periods (2014-2016). The analysis was based on data of the Information and Analytical system Globas.
Net assets is a ratio reflecting the real value of company’s property. It is calculated annually as the difference between assets on the enterprise balance and its debt obligations. The ratio is considered negative (insufficiency of property), if company’s debt exceeds the value of its property.
| Position in ТОP-1000 | Name, activity, region | Net assets value, mln. RUB | Solvency index Globas | ||
| 2014 | 2015 | 2016 | |||
| 1. | NAO KURILSKII RYBAK INN 6511000178 Sakhalin region |
6 129 | |
|
155 Superior |
| 2. | PAO OZERNOVSKII RKZ #55 INN 4108003484 Kamchatka Krai |
1 042 | |
|
158 Superior |
| 3. | USTKAMCHATRYBA CO., LTD INN 4109002780 Kamchatka Krai |
1 040 | |
|
174 Superior |
| 4. | LLC RYBOLOVETSKII KOLKHOZ IM. KIROVA INN 6504006429 Sakhalin region In process of reorganization in the form of merger of other legal entities, 12.12.2017 |
1 637 | |
|
209 Strong |
| 5. | LLC PROIZVODSTVENNO-KOMMERCHESKAYA FIRMA YUZHNO-KURILSKII RYBOKOMBINAT INN 6518005270 Sakhalin region |
543 | |
|
198 High |
| 996. | LLC PERSEI INN 6504027411 Sakhalin region |
-514 | |
|
357 Adequate |
| 997. | NAO RUSSIAN SEA INN 5031033020 Moscow region |
-1 146 | |
|
226 Strong |
| 998. | NAO KURILSKY RASSVET INN 6515001310 Sakhalin region |
-923 | |
|
243 Strong |
| 999. | NAO BALTIC COAST INN 7826059025 Leningrad region Process of being wound up, 03.05.2017 |
947 | |
|
600 Insufficient |
| 1000. | LLC RK KRUTOGOROVSKOE INN 4101094570 Kamchatka Krai |
-611 | |
|
346 Adequate |
![]() — growth indicator in comparison with prior period,
— growth indicator in comparison with prior period, ![]() — decline indicator in comparison with prior period.
— decline indicator in comparison with prior period.
For the last 10 years, the average values of net assets showed the increasing tendency (Picture 1)
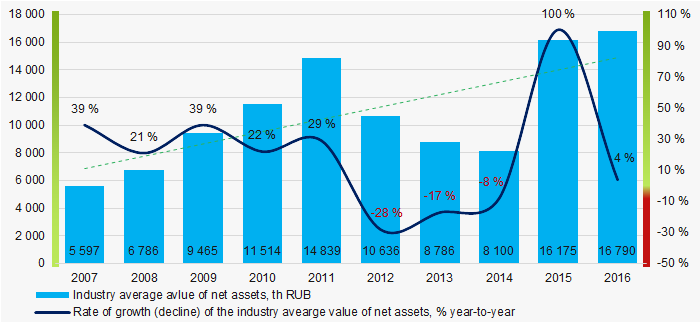 Picture 1. Change in average net assets value in 2007 — 2016
Sales revenue
In 2016 total revenue of 10 largest companies amounted to 37% from TOP-1000 total revenue. This fact testifies high level of competition within the industry (Picture 2).
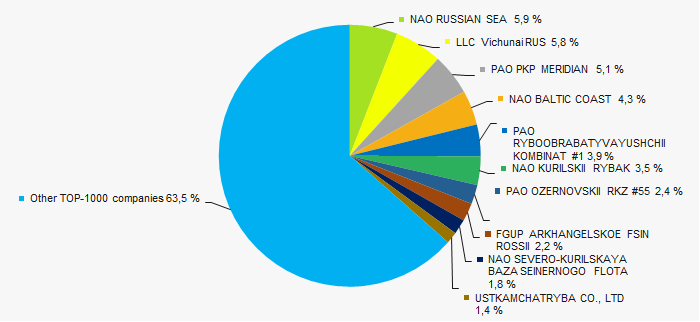 Picture 2. Shares of TOP-10 companies in TOP-1000 total revenue for 2016
In general, the decrease in sales revenue is observed (Picture 3).
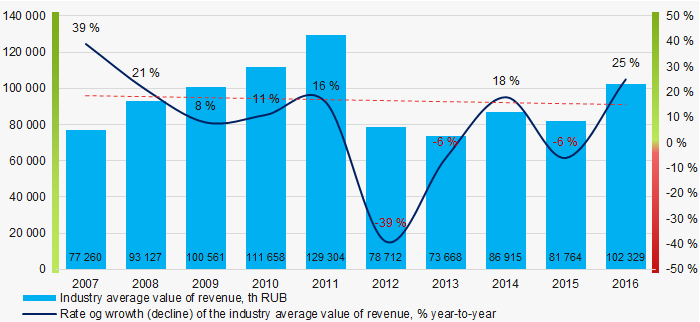 Picture 3. Change in average revenue in 2007 — 2016
Profit and loss
In 2016 profit of 10 largest companies amounted to 58% from TOP-1000 total profit (Picture 4).
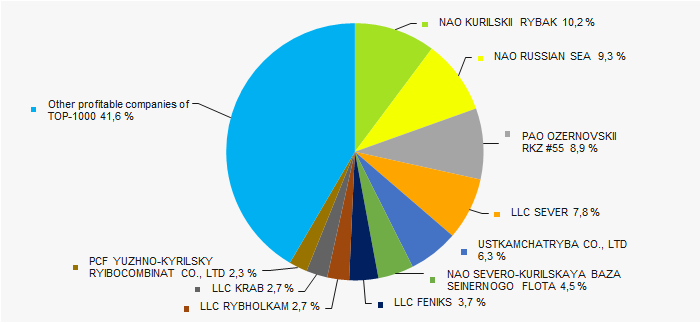 Picture 4. Shares of TOP-10 companies in TOP-1000 total profit for 2016
For the last ten years, the average industry net profit values show the growing tendency despite the losses in 2008, 2011, 2014 (Picture 5).
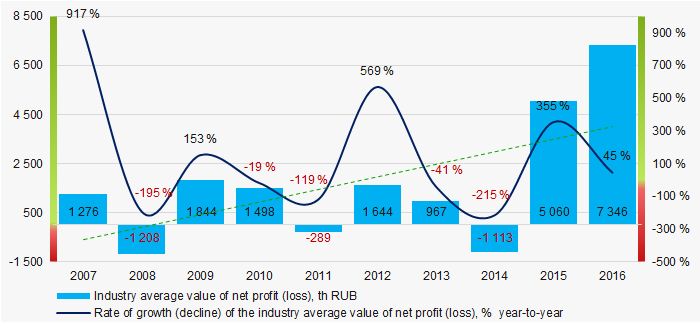 Picture 5. Change in average net profit in 2007 — 2016
For the three-year period, the average net profit values of TOP-1000 companies show the growing tendency. At the same time, the average net loss slightly increases (Picture 6).
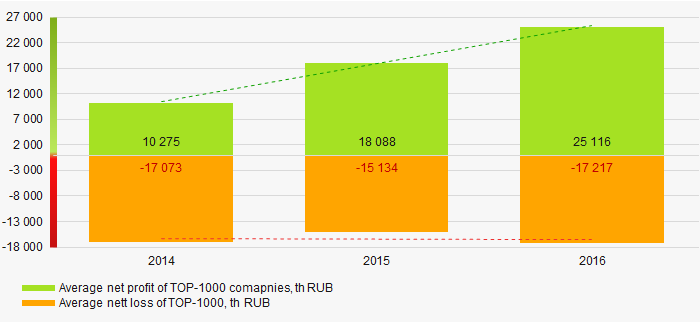 Picture 6. Change in average profit/loss of ТОP-1000 in 2007 — 2016
Main financial ratios
The current liquidity ratio (ratio of total working capital to short-term liabilities) shows the sufficiency of company’s assets to meet short-term obligations
For the last ten years, the average values of the current liquidity ratio were within the recommended values — from 1,0 to 2,0 (Picture 7). In general, the ratio shows the growing tendency.
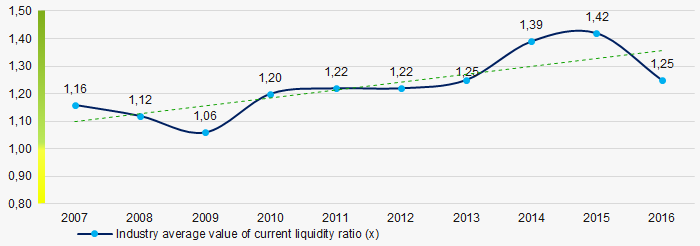 Picture 7. Change in average values of current liquidity ratio in 2007 — 2016
The ROI ratio is calculated as a ratio of net profit to sum of stockholder equity and long-term liabilities and shows the return from equity involved in commercial activities and long-term borrowed funds.
For the last ten years, the increasing tendency of ROI ratio is observed (Picture 8).
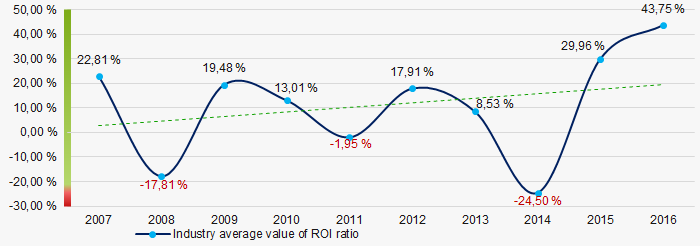 Picture 8. Change in average values of ROI ratio in 2007 — 2016
Assets turnover ratio is the ratio of sales revenue and company’s average total assets for a period. It characterizes the effectiveness of using of all available resources, regardless the source of their attraction. The ratio shows how many times per year the full cycle of production and circulation is performed, generating the corresponding effect in the form of profit.
For the last ten years, this business activity ratio demonstrated the downward trend (Picture 9).
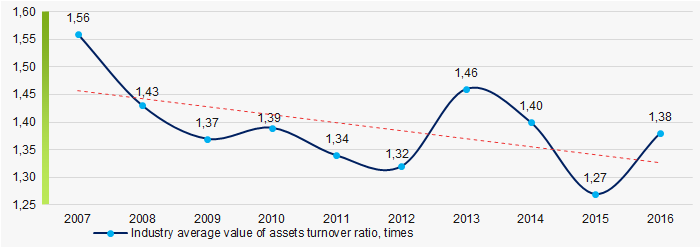 Picture 9. Change in average values of assets turnover ratio in 2007 — 2016
Production structure
92% companies of TOP-1000 are registered in the Register of small and medium-sized businesses of the Federal Tax Service of the Russian Federation (Picture 10).
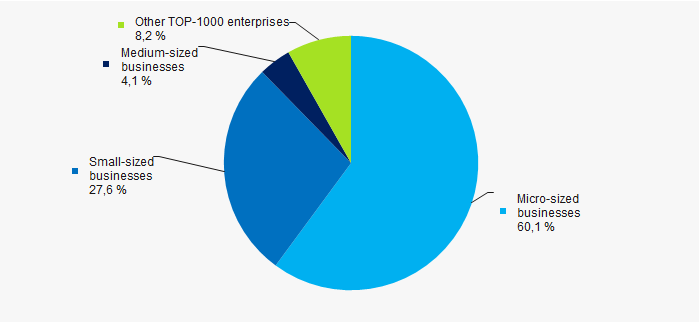 Picture 10. Shares of small and medium-sized enterprises in TOP-1000 companies of the industry, %
Main regions of activity
Companies of TOP-1000 are unequally located across the country due to dependence on the sources of raw materials and registered in 74 regions of Russia (Picture 11).
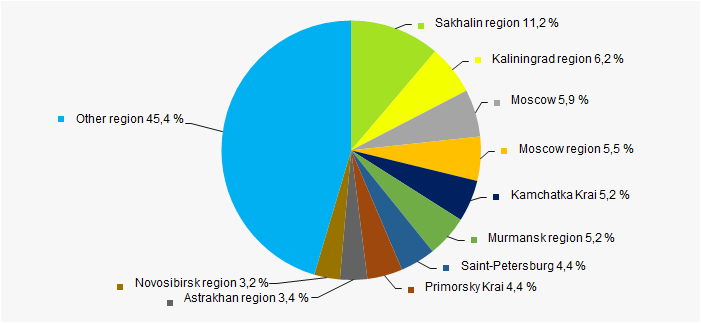 Picture 11. Distribution of TOP-1000 companies by the regions of Russia
Financial position score
An assessment of the financial position of TOP-1000 companies shows that the majority of them have financial position above average (Picture 12).
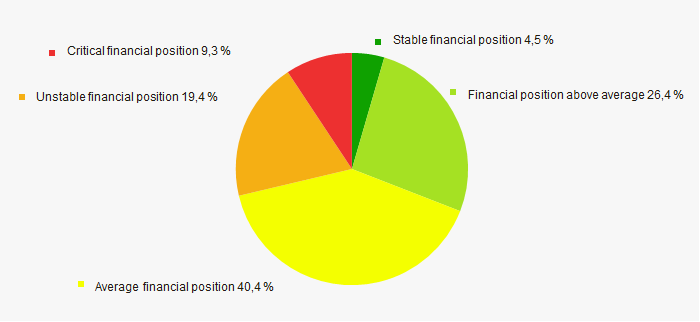 Picture 12. Distribution of TOP-1000 companies by financial position score
Solvency index Globas
Most of TOP-1000 companies got Superior/High or Strong/Medium Solvency index Globas, this fact shows the ability of the companies to meet their obligations in time and fully (Picture 13).
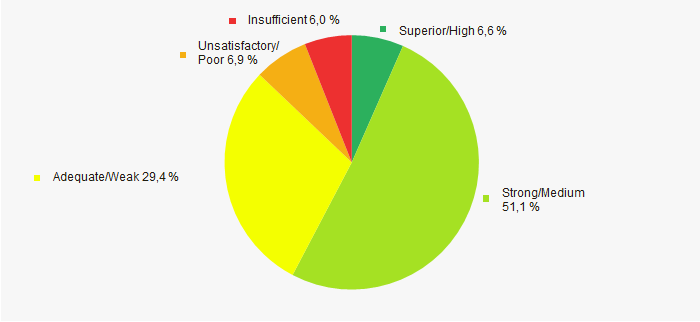 Picture 13. Distribution of TOP-1000 companies by solvency index Globas
Conclusion
A complex assessment of activity of the largest Russian companies engaged in processing and conservation of fish, crustaceans and mollusks, taking into account the main indexes, financial ratios and indicators, demonstrates the presence of favorable trends. However, declining revenue, increasing in net losses, decrease in business activity ratio are alarming factors.