
Order a report
Custom-made industry research, company ratings, competitor analysis


Russia becomes a safe haven for capital
For the whole period of data collection by the Central bank (from 1994 to the 1st half of 2017), total volume of foreign direct investment (FDI) in Russia amounted to 565,8 bln USD. Peak volume of investment to the domestic economy was observed during the period of 2006-2013 under favorable global conditions in commodity markets. Then the decline in investment activity took place and FDI inflow reduced to the minimal level since 2002. In 2016 the situation began to change and FDI volume amounted to 32,5 bln USD. In the 1st half of 2017 Russia has attracted 17,4 bln USD (see picture 2). This figure has increased in 2,3 times compared to the 1st half of 2016 with 7,5 bln USD.
FDI are investment of residents in the capital of a foreign company, attraction of debt instruments abroad (crediting), as well as reinvestment - capital investment in business objects on the territory of the RF at the expense of revenues, profits of a foreign investor or commercial organization. The structure of cumulative FDI for the period of 2010 – 1st half of 2017 is presented on the picture 1. Debt instruments of the company are the most commonly used mechanism for attracting investments (64,6% of total volume of cumulative FDI).
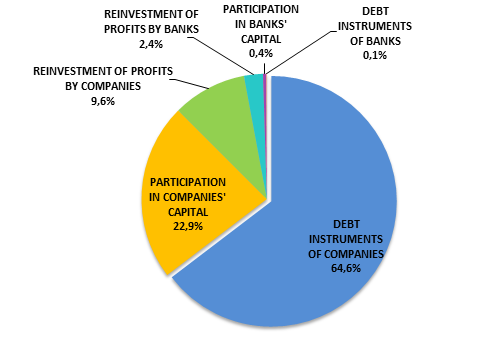 Picture 1. Structure of cumulative FDI in Russia for the period of 2010 – 1st half of 2017, % of total volume
To see the scale of investment in the RF, it is necessary to compare its volume with other countries. According to the World Bank, the USA with 479,4 bln USD of investment attracted in 2017 is an undisputable leader. France closes Top-10 and is inferior to the USA in 11 times – 42,3 bln USD; Russia – almost in 15 times.
| Rank | Country | FDI volume in 2016, bln USD |
| 1 | The USA | 479,4 |
| 2 | Great Britain | 299,7 |
| 3 | PRC | 170,6 |
| 4 | The Netherlands | 80,8 |
| 5 | Ireland | 79,2 |
| 6 | Brazil | 78,9 |
| 7 | Singapore | 61,6 |
| 8 | Germany | 52,5 |
| 9 | India | 44,4 |
| 10 | France | 42,3 |
ИInvestment is a double-edged sword: along with inflow, the outflow of capital takes place. From 1994 to the 1st half of 2017 605,1 bln USD were moved away. However capital outflow during the period in question was quite low – 39,3 bln USD. All time high withdrawal of 86,5 bln USD was recorded in 2013 and coincident with the beginning of a trend to reduce oil prices.
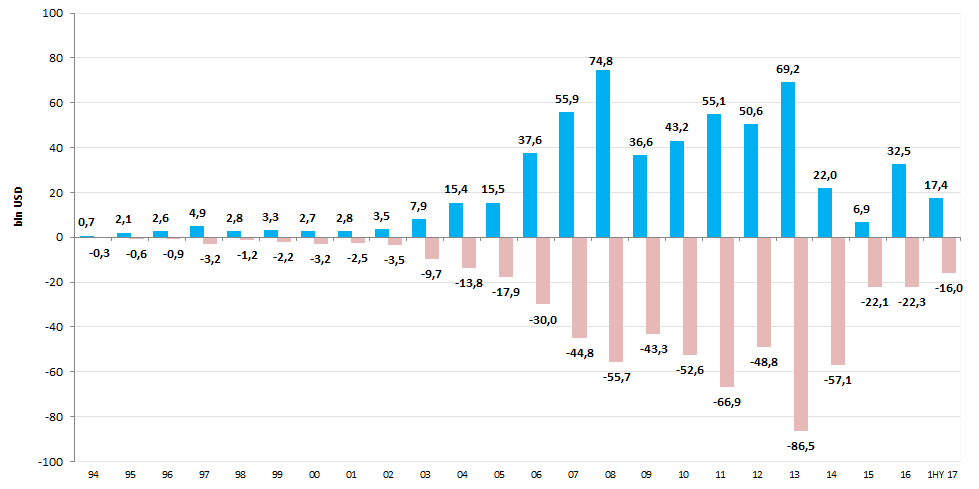 Picture 2. Dynamics of foreign direct investment in the RF and capital outflow, bln USD for the period of 1994 – 1st half of 2017
 Equally demonstrative is the picture 3 showing dynamics of balance of received and withdrawn investment. The most unfavorable situation was recorded in 2014 when aggravation of the geopolitical situation around Russia, being unprecedented in post-Soviet history, took place along with high volatility on commodity and exchange markets. It’s a fact that capital likes calm, and it rapidly moves to more stable and predictable jurisdictions at the time of turbulence.
For the first time in 8 years, in 2016 the positive balance of investments exceeded 10 bln USD. Such a good result was achieved only in 2007-2008. Hopefully, the balance will also be in the positive zone and the outflow of capital will not exceed investment in the Russian Federation by the end of 2017: if in the 1st half of 2016 the balance was negative -7,5 bln USD, then in the 1st half of 2017 it exceeded 1,4 bln USD.
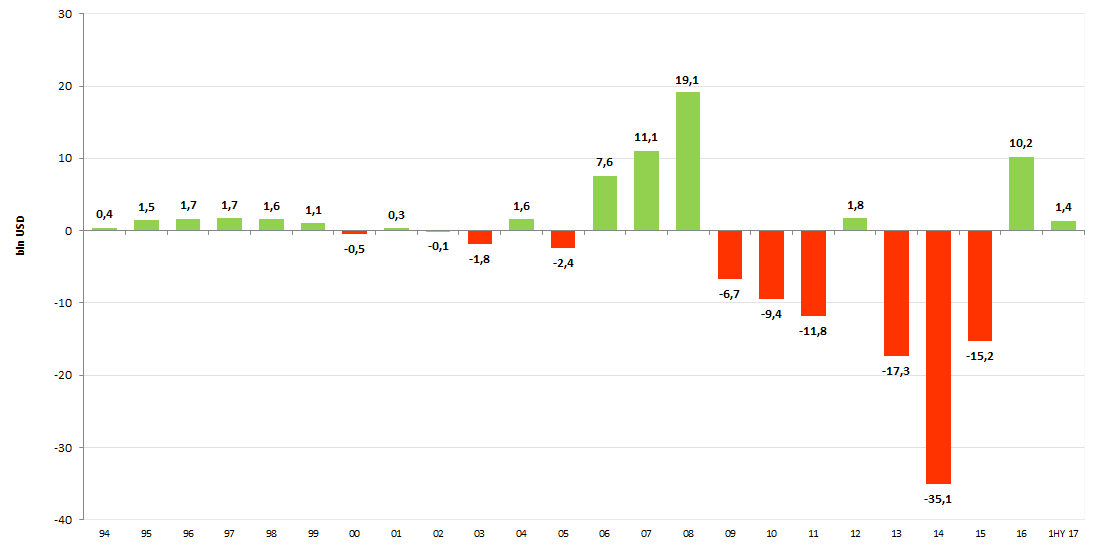 Picture 3. Dynamics of balance received to the RF and withdrawn investment, bln USD for the period of 1994 – 1st half of 2017
 Just FDI are of priority importance for the recipient country in general and for Russia in particular because of the following possibilities:
- Allow covering the shortage of cash resources of domestic companies for quick and large-scale re-equipment of the production base. All other types of foreign investment are mostly speculative and therefore short-term money, not allowing to implement such a task.
- Provide for borrowing of qualified management, since along with financial resources, the experience of a foreign investor in managing the activity of an investment object is received.
- Accelerate the process of inclusion of regional and sectoral economy in the world economy, development of effective integration processes.
- Promote employment growth and increase of social and economic stability of the country (region). Create stationary jobs, which is not the case for other types of foreign investment.
- Unlike loans and credits, FDI is not burdensome on external debt and even contribute to obtaining funds for its repayment.
- Stimulate the development of production of import-substituting and export products with a high share of added value. Only direct foreign investment implements the task of structural reorganization of the recipient country's economy, consisting in transition from raw materials industries to processing and from simple products to complex ones.