Foreign tourism to Russia is at record level
9,6 million foreign tourists from 187 countries have visited Russia in 2019, that became all-time record: our country has never been so open and caught such interest of foreign travelers. Over a ten-year period, compared to 2010, inbound tourist flow has 1,5 increased. This amount does not contained residents from the former Soviet states, for those Russia remains a place of kinship or seasonal works.
Chinese tourist groups have formed in 2019 quarter of all tourist flow: amount of travelers from the PRC was 2,3 million people, that is on 11,2% bigger than in 2018 and 3 times higher than in 2010.
Second and third places with significant distance take tourists from Finland – 939 thousand and Germany - 744 thousand people correspondingly (s. picture 1).
Apart from China, amount of tourists from the Republic of Korea has significantly increased: 5 times growth of the indicator stated, compared to 2010, up to 454 thousand people in 2019.
Since January 1, 2021 for visiting all territory of Russia foreign tourists will receive single entry e-visa filled out via Internet. There is no need to have invitations, hotel reservations or any other documents confirming purpose of travel to the RF for receiving such visa. Similar order is already active for residents of 53 states (including EU countries) in Saint Petersburg, Leningrad and Kaliningrad regions, and regions of the Far Eastern Federal District. Such measures should encourage those who did not want to go through difficult process of receipt of the Russian visa in embassy or consul residence.
Unfortunately, there is a possibility that current year will be less favorable for incoming tourism. Outbreak of coronaviral infection in china has led to suspension of charter traffic with the Celestial Empire, and since February 20, Russia closes borders for all residents of the PRC, that leads to termination of tourist flow.
Picture 1. TOP-10 countries in terms of amount of foreign tourists to Russia in 2019, thousands of people (except for former Soviet states)
 Picture 1. TOP-10 countries in terms of amount of foreign tourists to Russia in 2019, thousands of people (except for former Soviet states)
Plenty of companies represent market of the incoming tourism of Russia. Currently, 3 199 firms have qualifying license, the industry is not monopolized. Users of Globas have access to the «Сompany's position in the industry», with the help of that instrument share of every contractor at the market can be defined (s. table 1).
| № | Company | Revenue, 2018 | Share |
| 1 | LLC AKADEMSERVIS | 5,1 billion RUB | 5,5% |
| 2 | LLC VODOHOD | 4,6 billion RUB | 4,9% |
| 3 | LLC ТТ-TRAVEL | 2,9 billion RUB | 3,1% |
Tourist industry serves as an indicator of economic well-being. Slowdown in global economic growth, uncertainties related to coronavirus, and geopolitical and business tension can stimulate investors and travelers to take a wait-and-see approach. Nevertheless, according to current trends, growth of tourist flow to Russia will be increased.
Trends in gambling
Information agency Credinform has prepared a review of activity trends of the largest Russian gambling organizations.
The largest companies (ТОP-100) engaged in conducting of lotteries, gambling establishments, bookmakers and betting houses in terms of annual revenue were selected according to the data from the Statistical Register for the latest available periods (2013 - 2018). The analysis was based on data of the Information and Analytical system Globas.
Net assets is a ratio reflecting the real value of company's property. It is calculated annually as the difference between assets on the enterprise balance and its debt obligations. The ratio is considered negative (insufficiency of property), if company’s debt exceeds the value of its property.
The largest company in terms of net assets is LLC MELOFON, INN 2540179758, Moscow. In 2018 net assets of the company amounted to 5,9 billion RUB.
The smallest size of net assets in ТОP-100 had JSC LOTTERIES OF MOSCOW, INN 7715215381, Moscow. The lack of property of the company in 2018 was expressed in negative terms -213 million RUB.
For the last ten years, the average values of net assets showed the growing tendency (Picture 1).
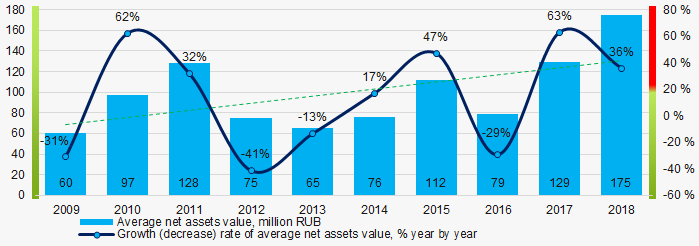 Picture 1. Change in average net assets value in 2009 – 2018
 For the last five years, the share of ТОP-100 enterprises with lack of property showed the decreasing tendency (Picture 2).
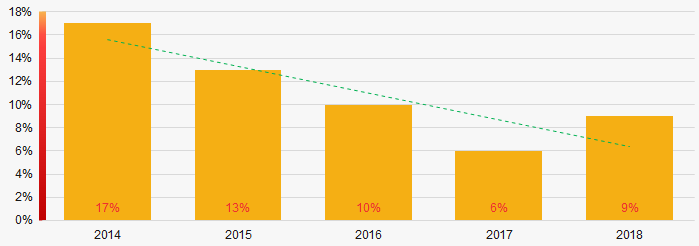 Picture 2. The share of enterprises with negative net assets value in ТОP-100
Sales revenue
In 2018, the total revenue of 10 largest companies amounted to more than 94% from ТОP-100 total revenue. (Picture 3).This fact testifies the high level of monopolization within the industry.
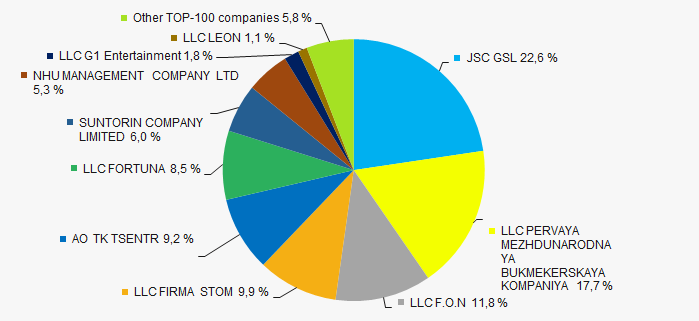 Picture 3. Shares of TOP-10 in TOP-100 total revenue for 2018
In general, the growing trend in sales revenue is observed (Picture 4).
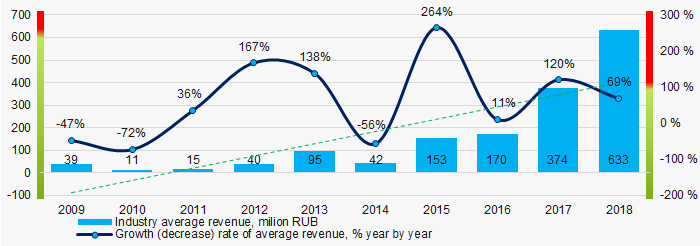 Picture 4. Change in average revenue in 2009 – 2018
Profit and loss
The largest company in terms of net profit is LLC F.O.N, INN 9715010229, Moscow. In 2018, the company’s profit amounted to 9,3 billion RUB.
For the last ten years, the average profit values showed the increasing tendency (Picture 5).
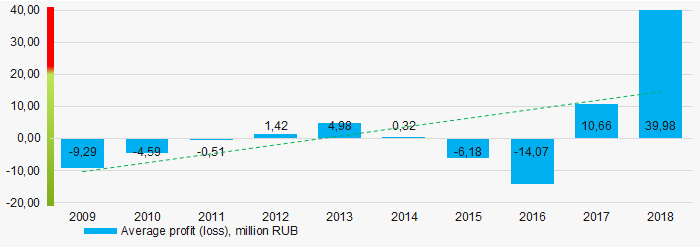 Picture 5. Change in average profit (loss) in 2009 – 2018
Over a five-year period, the average net profit values of ТОP-100 show the increasing tendency, along with this the average net loss is increasing too (Picture 6).
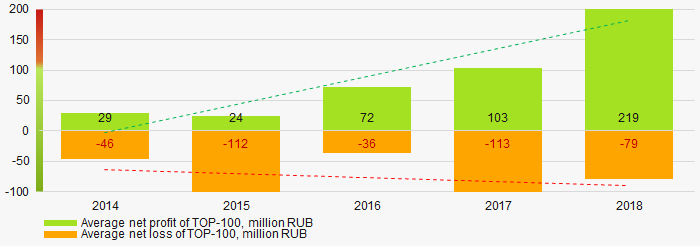 Picture 6. Change in average net profit/loss in 2014 – 2018
Main financial ratios
Since 2013 the average values of the current liquidity ratio are within the recommended values - from 1,0 to 2,0, with decreasing tendency (Picture 7).
The current liquidity ratio (ratio of total working capital to short-term liabilities) shows the sufficiency of company’s assets to meet short-term obligations.
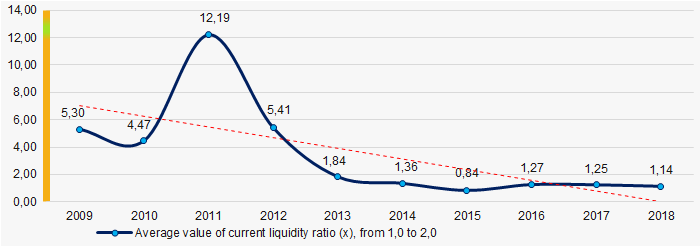 Picture 7. Change in average values of current liquidity ratio in 2009 – 2018
For the last ten years, the growing tendency of ROI ratio is observed (Picture 8).
The ROI ratio is calculated as a ratio of net profit to sum of stockholder equity and long-term liabilities and shows the return from equity involved in commercial activities and long-term borrowed funds.
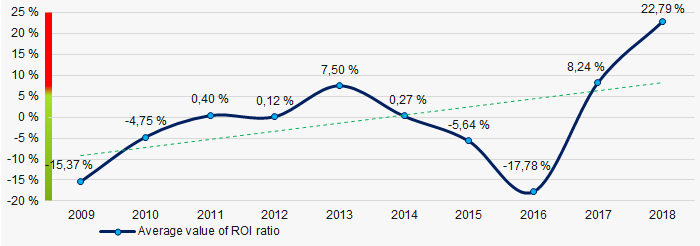 Picture 8. Change in average values of ROI ratio in 2009 – 2018
Assets turnover ratio is the ratio of sales revenue and company’s average total assets for a period. It characterizes the effectiveness of using of all available resources, regardless the source of their attraction. The ratio shows how many times per year the full cycle of production and circulation is performed, generating the corresponding effect in the form of profit.
For the last ten years, this business activity ratio demonstrated the growing trend (Picture 9).
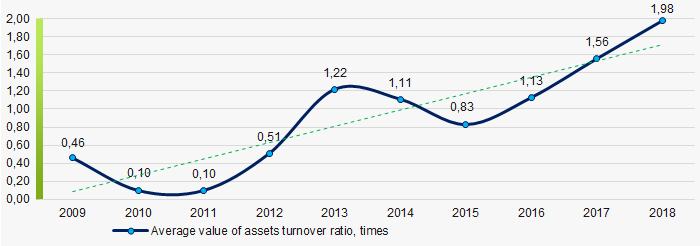 Picture 9. Change in average values of assets turnover ratio in 2009 – 2018
 Small businesses
79% of ТОP-100 companies are registered in the Unified register of small and medium-sized enterprises of the Russian Federal Tax Service. Herein, their share in TOP-100 total revenue amounted to 3,2%, which is significantly lower than national average value (Picture 10).
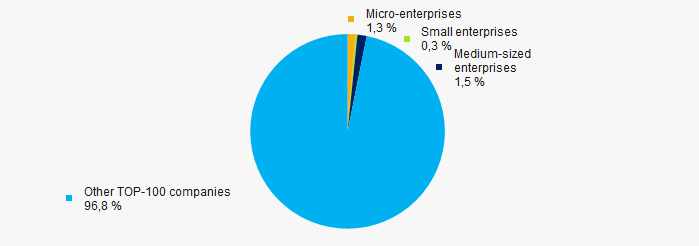 Picture 10. Shares of small and medium-sized enterprises in ТОP-100
Main regions of activity
ТОP-100 companies are registered in 43 regions and unequally located across the country. More than 82% of the largest enterprises in terms of revenue are located in Moscow (Picture 11).
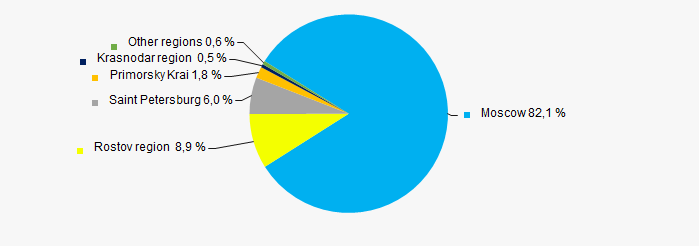 Picture 11. Distribution of TOP-100 revenue by regions of Russia
Financial position score
An assessment of the financial position of TOP-100 companies shows that the largest part have the above average financial position (Picture 12).
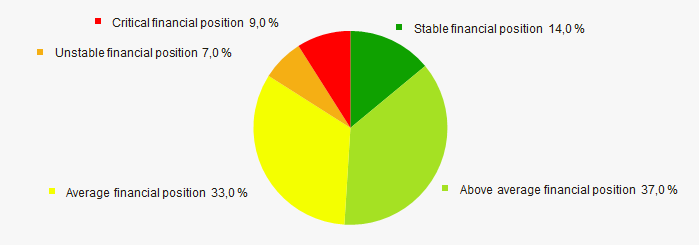 Picture 12. Distribution of TOP-100 companies by financial position score
Solvency index Globas
Most of TOP-100 companies got superior/high or strong/medium Solvency index Globas, this fact shows the ability of the companies to meet their obligations in time and fully (Picture 13).
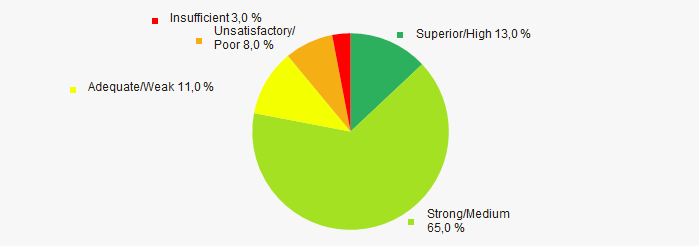 Picture 13. Distribution of TOP-100 companies by Solvency index Globas
According to the Federal Service of State Statistics, the share of enterprises in total revenue from sale of goods, products, works and services within country amounted to 0,061% in 2018 and 0,093% for 9 months of 2019, which is higher than the figure for the same period in 2018 (0,062%).
Conclusion
A complex assessment of the largest Russian gambling organizations, taking into account the main indexes, financial ratios and indicators, demonstrates the presence of positive trends (Table 1).
| Trends and assessment factors | Relative share, % |
| Growth/drawdown rate of average net assets value |  10 10 |
| Increase / decrease in the share of enterprises with negative net assets |  10 10 |
| The level of competition / monopolization |  -10 -10 |
| Growth/drawdown rate of average revenue |  10 10 |
| Growth/drawdown rate of average net profit (loss) |  10 10 |
| Increase / decrease in average net profit |  10 10 |
| Increase / decrease in average net loss |  -10 -10 |
| Increase / decrease in average values of current liquidity ratio |  -5 -5 |
| Increase / decrease in average values of ROI ratio |  10 10 |
| Increase / decrease in average values of assets turnover ratio, times |  10 10 |
| Share of small and medium-sized businesses by revenue more than 20% |  -10 -10 |
| Regional concentration |  -10 -10 |
| Financial position (the largest share) |  10 10 |
| Dynamics of the share of the region's revenue in the total revenue of the Russian Federation |  10 10 |
| Solvency index Globas (the largest share) |  10 10 |
| Average value of factors |  3,7 3,7 |
 favorable trend (factor),
  unfavorable trend (factor).