
Order a report
Custom-made industry research, company ratings, competitor analysis


Accounts payable of furniture manufacturers
Information agency Credinform has prepared a ranking of the largest Russian furniture manufacturers. The companies with the largest annual revenue (TOP-10) were selected for the ranking, according to the data from the Statistical Register for the latest available accounting periods (2015 - 2017). Then they were ranked by accounts payable turnover ratio (Table 1). The analysis was based on the data from the Information and Analytical system Globas.
Accounts payable turnover ratio (days) is a ratio of average accounts payable for the period to sales revenue. The ratio indicates the number of days it took the company to pay its average payables.
The ratio reflects debt redemption to counterparties, and is calculated for assessment of money flow in order to make conclusions about company’s performance and its financial strategy’s efficiency.
The lower the ratio the faster the enterprise pays its debts to suppliers. Increase in turnover may indicate either difficulties in accounts settlement, or a more efficient management of relations with suppliers that provides a more profitable, deferred payment schedule, and uses payables as a source of cheap financial resources.
A calculation of practical values of financial ratios, that might be considered as normal for a certain industry, has been developed and implemented in the Information and Analytical system Globas by the experts of Information Agency Credinform, having taken into account the current situation in the economy as a whole and in the industries. Practical value of accounts payable turnover amonts up to 90.88 days for furniture manufacturers.
All indicators and financial ratios are to be considered to get a full and comprehensive vision of company’s financial standing.
| Name, INN, region, core activity |
Sales revenue, billion RUB |
Net profit (loss), billion RUB |
Accounts receivable turnover, days |
Solvency index Globas | |||
| 2016 | 2017 | 2016 | 2017 | 2016 | 2017 | ||
| 1 | 2 | 3 | 4 | 5 | 6 | 7 | 8 |
| OZ Micron NJSC INN 6002005478 Pskov region Manufacture of office and shop furniture |
|
|
|
|
|
|
177 Superior |
| IKEA INDUSTRY TIKHVIN LLC INN 4715011103 Leningrad region Manufacture of furniture |
|
|
|
|
|
|
226 Strong |
| King of Sofas LLC INN 6432009756 Saratov region ПManufacture of other furniture |
|
|
|
|
|
|
293 Medium |
| ASKONA-VEK LLC INN 3305037917 Vladimir region Manufacture of mattresses |
|
|
|
|
|
|
218 Strong |
| DOK-15 LLC INN 5050079140 Moscow region Manufacture of kitchen furniture |
|
|
|
|
|
|
219 Strong |
| JOINT STOCK FURNITURE COMPANY SHATURA INN 5049007736 Moscow region Manufacture of other furniture |
|
|
|
|
|
|
202 Strong |
| ALIVE SOFAS LLC INN 5029042443 Moscow region Manufacture of other furniture |
|
|
|
|
|
|
257 Medium |
| MEBEL STIL LLC INN 3907046732 Kaliningrad region Manufacture of furniture |
|
|
|
|
|
|
253 Medium |
| Furniture Factory Marya LLC INN 6455026772 Saratov region Manufacture of kitchen furniture |
|
|
|
|
|
|
204 Strong |
| MZ5 GROUP LLC INN 4312146860 Kirov region Manufacture of furniture |
|
|
|
|
|
|
304 Adequate |
| Total for TOP-10 companies | |
|
|
|
|||
| Average value for TOP-10 companies | |
|
|
|
|
|
|
| Industry average value | |
|
|
|
|
|
|
![]() — improvement compared to prior period,
— improvement compared to prior period, ![]() — decline compared to prior period.
— decline compared to prior period.
Average value of accounts payable turnover of TOP-10 companies is above the industry average value. In 2017 six of TOP-10 companies showed improvement of the indicator.
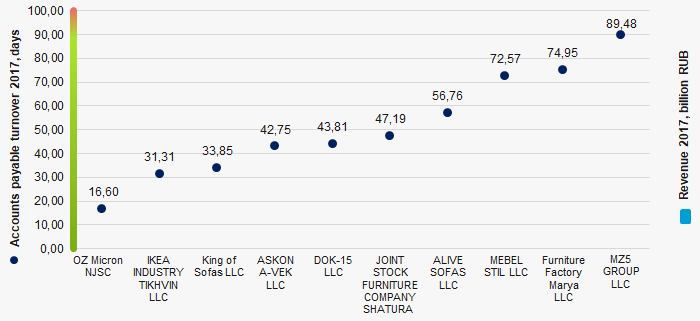 Picture 1. Accounts payable turnover and revenue of the largest Russian furniture manufacturers (TOP-10)
During the decade average industry values of accounts payable turnover tend to decrease (Picture 2).
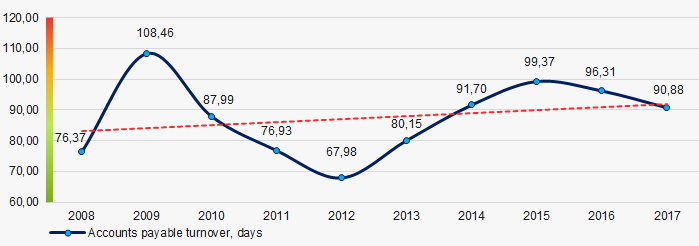 Picture 2. Change of industry average values of accounts payable turnover ratio of Russian furniture manufacturers in 2008 – 2017