
Order a report
Custom-made industry research, company ratings, competitor analysis


Return on sales in fish trade
Information agency Credinform represents the ranking of the largest Russian wholesalers of fish and seafood. The trading companies with the largest volume of annual revenue (TOP-10) were selected for the ranking, according to the data from the Statistical Register for the latest available periods (for 2015 - 2017). Then they were ranked by return on sales ratio (Table 1). The analysis was made on the basis of the data of the Information and Analytical system Globas.
Return on sales (%) is calculated as the share of operating profit in the total sales of a company. The ratio reflects the efficiency of industrial and commercial activity of an enterprise and shows the share of company’s funds obtained as a result of sale of products, after covering its cost price, paying taxes and interest payments on loans.
The spread in values of the return of sales in companies of the same industry is determined by differences in competitive strategies and product lines.
The experts of the Information agency Credinform, taking into account the actual situation both in the economy as a whole and in the sectors, has developed and implemented in the Information and Analytical system Globas the calculation of practical values of financial ratios that can be recognized as normal for a particular industry. For wholesalers of fish and seafood the practical value of the return on sales ratio made 2,74% in 2017.
For getting of the most comprehensive and fair picture of the financial standing of an enterprise it is necessary to pay attention to all combination of indicators and financial ratios.
| Name, INN, region | Revenue, million rubles | Net profit (loss), million rubles | Return on sales, % | Solvency index Globas | |||
| 2016 | 2017 | 2016 | 2017 | 2016 | 2017 | ||
| 1 | 2 | 3 | 4 | 5 | 6 | 7 | 8 |
| ISLAND CO LTD INN 7819025427 Saint-Petersburg |
|
|
|
|
|
|
208 Strong |
| RUSSIAN FISH COMPANY NJSC INN 7701174512 Moscow |
|
|
|
|
|
|
175 High |
| SK RITEIL NJSC INN 7743703239 Moscow In process of reorganization in the form of acquisition of other legal entities, 25.05.2016. |
|
|
|
|
|
|
240 Strong |
| SK RYBA LLC INN 7743632267 Moscow |
|
|
|
|
|
|
212 Strong |
| ISOLA LLC INN 7811445525 Saint-Petersburg |
|
|
|
|
|
|
233 Strong |
| LA MAREE LLC INN 7705360936 Moscow |
|
|
|
|
|
|
233 Strong |
| BLOK DMITRIYA DONSKOGO LLC INN 3905036023 Kaliningrad region |
|
|
|
|
|
|
216 Strong |
| MAGUROS LLC INN 7736544838 Moscow |
|
|
|
|
|
|
197 High |
| NOREBO RU NJSC INN 5190908693 Murmansk region |
|
|
|
|
|
|
283 Medium |
| BREMOR LLC INN 7722206719 Moscow region |
|
|
|
|
|
|
296 Medium |
| Total by TOP-10 companies | |
|
|
|
|||
| Average value by TOP-10 companies | |
|
|
|
|
|
|
| Industry average value | |
|
|
|
|
|
|
![]() — improvement of the indicator to the previous period,
— improvement of the indicator to the previous period, ![]() — decline in the indicator to the previous period.
— decline in the indicator to the previous period.
The average value of the return on sales ratio of TOP-10 companies is below the industry average one and practical value. Three companies improved the result in 2017.
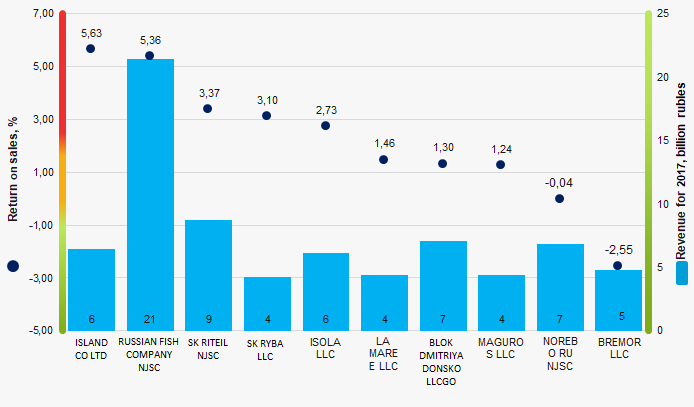 Picture 1. Return on sales ratio and revenue of the largest Russian wholesalers of fish and seafood (TOP-10)
The industry average indicators of the return on sales ratio have a downward trend over the course of 10 years (Picture 2).
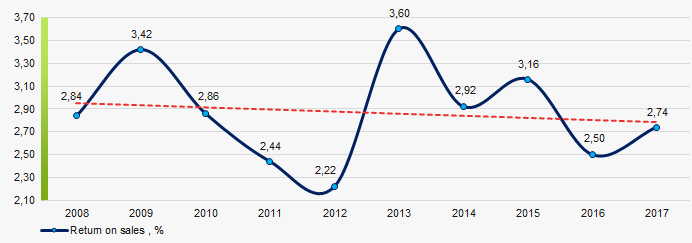 Picture 2. Change in the industry average values of the return on sales ratio of Russian wholesalers of fish and seafood in 2008 – 2017