Trends in wholesale of fish
Information agency Credinform represents an overview of activity trends of the largest Russian wholesalers of fish and seafood.
Trading companies with the largest volume of annual revenue (TOP-10 and TOP-1000) were selected for the analysis, according to the data from the Statistical Register for the latest available periods (for 2015 – 2017). The analysis was made on the basis of the data of the Information and Analytical system Globas.
Net assets value is an indicator, reflecting the real value of company’s property, is calculated annually as the difference between assets on the enterprise balance and its debt obligations. The indicator of net assets is considered negative (insufficiency of property), if company’s debt exceeds the value of its property.
The average values of net assets of TOP-1000 enterprises tend to increase over the ten-year period (Picture 1).
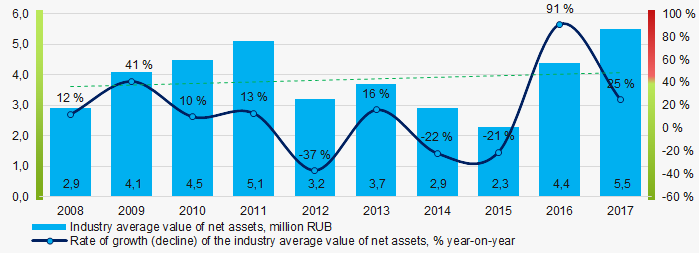 Picture 1. Change in the industry average indicators of the net asset value of wholesalers of fish and seafood in 2008 – 2017
The shares of TOP-1000 enterprises with insufficiency of assets were at relatively high level with a downward trend in the last three years (Picture 2).
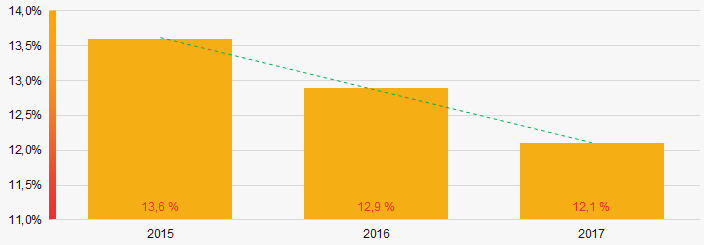 Picture 2. Shares of enterprises with negative values of net assets in TOP-1000 in 2015 – 2017
Sales revenue
The revenue volume of 10 leading companies of the region made 31% of the total revenue of TOP-1000 in 2017 (Picture 3). It points to a relatively high level of competition in the industry.
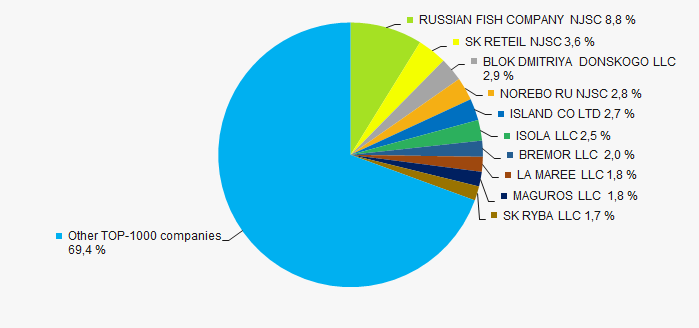 Picture 3. Shares of participation of TOP-10 companies in the total revenue of TOP-1000 enterprises for 2017
In general, there is a trend towards a decrease in industry average revenue over the ten-year period (Picture 4).
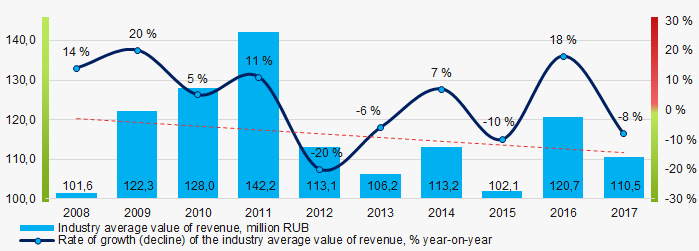 Picture 4. Change in the industry average revenue of TOP-100 wholesalers of fish and seafood in 2008 – 2017
Profit and loss
Industry average indicators of net profit trends to increase over the past ten years (Picture 5).
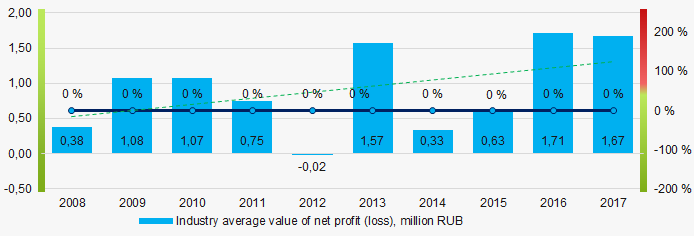 Picture 5. Change in the industry average indicators of net profit of wholesalers of fish and seafood in 2008 – 2017
Average values of net profit’s indicators of TOP-1000 companies increase for the three-year period, at the same time the average value of net loss decreases. (Picture 6).
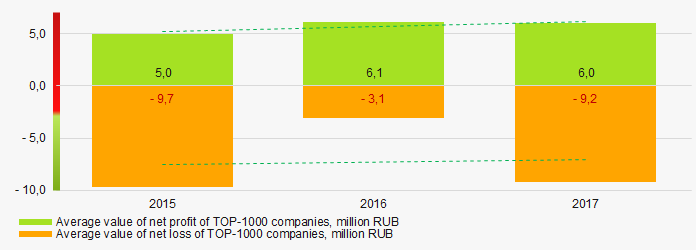 Picture 6. Change in the average values of indicators of net profit and net loss of TOP-1000 companies in 2015 – 2017
Key financial ratios
Over the ten-year period the average indicators of the total liquidity ratio of TOP-1000 enterprises were in the range of recommended values - from 1,0 up to 2,0, with a tendency to decrease (Picture 7).
The total liquidity ratio (the relation of the amount of current assets to short-term liabilities) shows the sufficiency of company’s funds for repayment of its short-term liabilities.
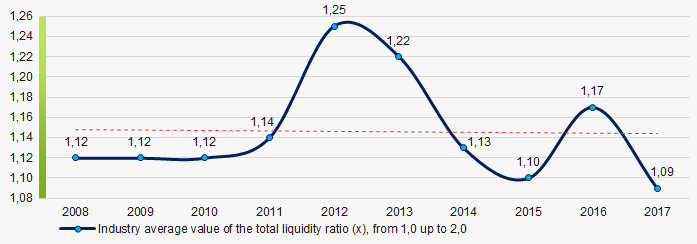 Picture 7. Change in the industry average values of the total liquidity ratio of wholesalers of fish and seafood in 2008 – 2017
The industry average values of the return on investment ratio trend to decrease for ten years (Picture 8).
The ratio is calculated as the relation of net profit to the sum of own capital and long-term liabilities and demonstrates the return on the equity of own capital involved in the commercial activity and the long-term borrowed funds of an organization.
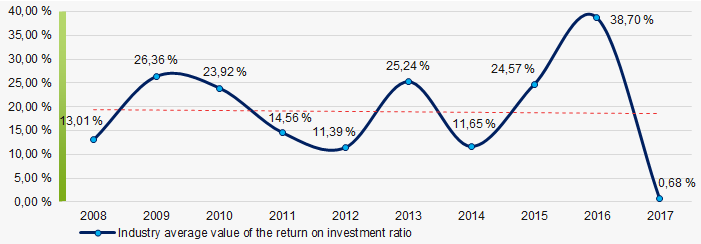 Picture 8. Change in the industry average values of the return on investment ratio of wholesalers of fish and seafood in 2008 – 2017
Asset turnover ratio is calculated as the relation of sales proceeds to the average value of total assets for a period and characterizes the efficiency of use of all available resources, regardless of the sources of their attraction. The ratio shows how many times a year a complete cycle of production and circulation is made, yielding profit.
This ratio of business activity trends to decrease over ten-year period (Picture 9).
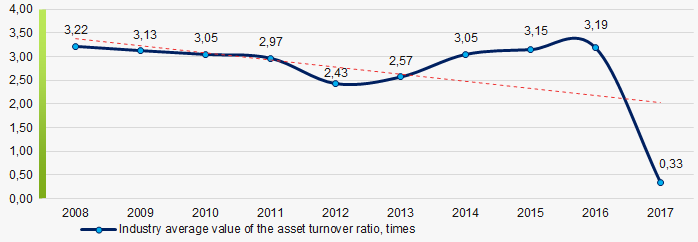 Picture 9. Change in the industry average values of the asset turnover ratio of wholesalers of fish and seafood in 2008 – 2017
Small business
95% of TOP-1000 companies are registered in the Register of small and medium-sized enterprises of the Federal Tax Service of the RF. At the same time, their share in the total revenue amounted to 57% in 2017, that is more than two times higher than the national average one (Picture 10).
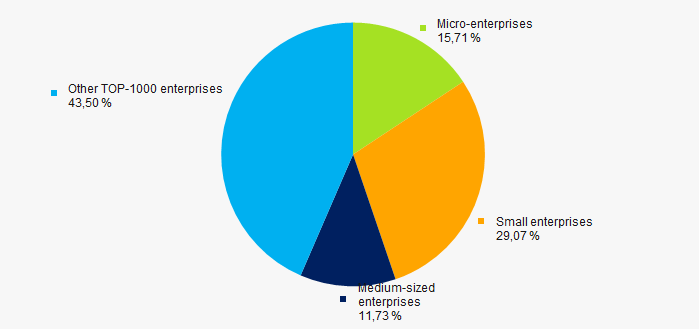 Picture 10. Shares of proceeds of small and medium-sized enterprises in TOP-1000 companies, %
Main regions of activity
The TOP-1000 companies are distributed unequal across Russia and registered in 69 regions. Almost 59% of their revenue are concentrated in Moscow, Saint-Petersburg and the Primorye territory (Picture 11).
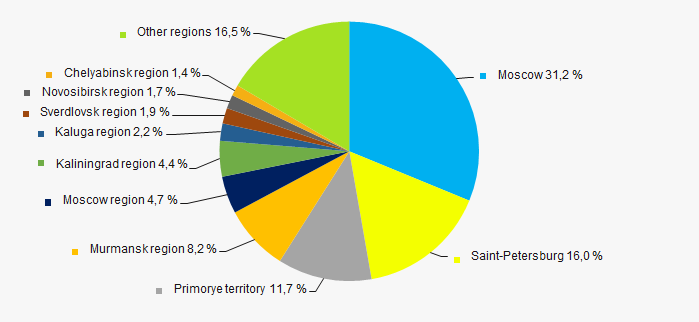 Picture 11. Distribution of the revenue of TOP-1000 companies by Russian regions
Financial position score
An assessment of the financial position of TOP-1000 companies shows that almost half of them are in an average financial position (Picture 12).
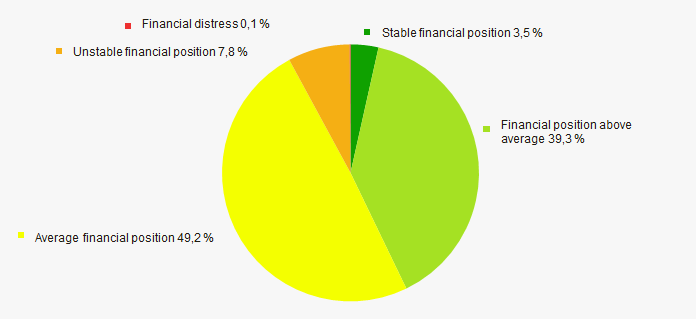 Picture 12. Distribution of TOP-1000 companies by financial position score
Solvency index Globas
The largest part of TOP-1000 companies got Superior/High or Strong/Medium solvency index Globas, that points to their ability to pay off their debts in time and fully (Picture 13).
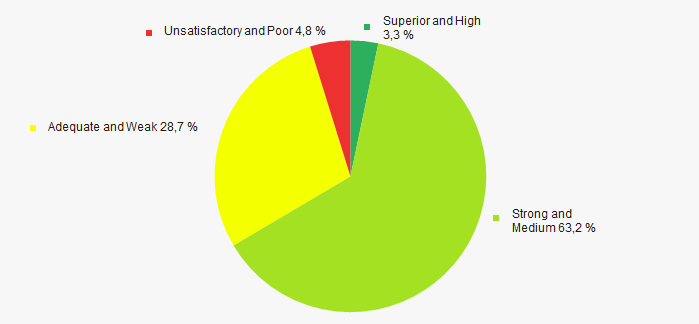 Picture 13. Distribution of TOP-1000 companies by solvency index Globas
According to the Federal Service of State Statistics, the share of wholesalers of fish and seafood in the revenue volume from the sale of goods, products, works, and services made 0,05% countrywide for 2018.
Conclusion
A comprehensive assessment of activity of the largest Russian wholesalers of fish and seafood, taking into account the main indices, financial indicators and ratios, points to the prevalence of positive trends in the industry (Table 1).
 — positive trend (factor),
  — negative trend (factor).
| Trends and evaluation factors | Specific share of factor, % |
| Rate of growth (decline) in the average size of net assets |  10 10 |
| Increase / decrease in the share of enterprises with negative values of net assets |  5 5 |
| Rate of growth (decline) in the average size of revenue |  -10 -10 |
| Level of competition / monopolization |  10 10 |
| Rate of growth (decline) in the average size of profit (loss) |  10 10 |
| Growth / decline in average values of companies’ net profit |  10 10 |
| Growth / decline in average values of companies’ net loss |  10 10 |
| Increase / decrease in average values of total liquidity ratio |  -5 -5 |
| Increase / decrease in average values of return on investment ratio |  -5 -5 |
| Increase / decrease in average values of asset turnover ratio, times |  -10 -10 |
| Share of small and medium-sized businesses in the region in terms of revenue being more than 22% |  10 10 |
| Regional concentration |  -10 -10 |
| Financial position (the largest share) |  5 5 |
| Solvency index Globas (the largest share) |  10 10 |
| Average value of factors |  2,9 2,9 |
Return on sales in fish trade
Information agency Credinform represents the ranking of the largest Russian wholesalers of fish and seafood. The trading companies with the largest volume of annual revenue (TOP-10) were selected for the ranking, according to the data from the Statistical Register for the latest available periods (for 2015 - 2017). Then they were ranked by return on sales ratio (Table 1). The analysis was made on the basis of the data of the Information and Analytical system Globas.
Return on sales (%) is calculated as the share of operating profit in the total sales of a company. The ratio reflects the efficiency of industrial and commercial activity of an enterprise and shows the share of company’s funds obtained as a result of sale of products, after covering its cost price, paying taxes and interest payments on loans.
The spread in values of the return of sales in companies of the same industry is determined by differences in competitive strategies and product lines.
The experts of the Information agency Credinform, taking into account the actual situation both in the economy as a whole and in the sectors, has developed and implemented in the Information and Analytical system Globas the calculation of practical values of financial ratios that can be recognized as normal for a particular industry. For wholesalers of fish and seafood the practical value of the return on sales ratio made 2,74% in 2017.
For getting of the most comprehensive and fair picture of the financial standing of an enterprise it is necessary to pay attention to all combination of indicators and financial ratios.
| Name, INN, region | Revenue, million rubles | Net profit (loss), million rubles | Return on sales, % | Solvency index Globas | |||
| 2016 | 2017 | 2016 | 2017 | 2016 | 2017 | ||
| 1 | 2 | 3 | 4 | 5 | 6 | 7 | 8 |
| ISLAND CO LTD INN 7819025427 Saint-Petersburg |
 6840 6840 |
 6458 6458 |
 271 271 |
 242 242 |
 6,33 6,33 |
 5,63 5,63 |
208 Strong |
| RUSSIAN FISH COMPANY NJSC INN 7701174512 Moscow |
 17592 17592 |
 21426 21426 |
 641 641 |
 688 688 |
 6,07 6,07 |
 5,36 5,36 |
175 High |
| SK RITEIL NJSC INN 7743703239 Moscow In process of reorganization in the form of acquisition of other legal entities, 25.05.2016. |
 7869 7869 |
 8701 8701 |
 20 20 |
 15 15 |
 3,38 3,38 |
 3,37 3,37 |
240 Strong |
| SK RYBA LLC INN 7743632267 Moscow |
 4254 4254 |
 4250 4250 |
 7 7 |
 83 83 |
 0,72 0,72 |
 3,10 3,10 |
212 Strong |
| ISOLA LLC INN 7811445525 Saint-Petersburg |
 6098 6098 |
 6148 6148 |
 168 168 |
 153 153 |
 2,57 2,57 |
 2,73 2,73 |
233 Strong |
| LA MAREE LLC INN 7705360936 Moscow |
 9881 9881 |
 4417 4417 |
 60 60 |
 21 21 |
 -1,15 -1,15 |
 1,46 1,46 |
233 Strong |
| BLOK DMITRIYA DONSKOGO LLC INN 3905036023 Kaliningrad region |
 8058 8058 |
 7072 7072 |
 87 87 |
 43 43 |
 1,43 1,43 |
 1,30 1,30 |
216 Strong |
| MAGUROS LLC INN 7736544838 Moscow |
 3874 3874 |
 4363 4363 |
 41 41 |
 9 9 |
 1,56 1,56 |
 1,24 1,24 |
197 High |
| NOREBO RU NJSC INN 5190908693 Murmansk region |
 5526 5526 |
 6829 6829 |
 27 27 |
 -22 -22 |
 0,81 0,81 |
 -0,04 -0,04 |
283 Medium |
| BREMOR LLC INN 7722206719 Moscow region |
 4714 4714 |
 4757 4757 |
 140 140 |
 -250 -250 |
 3,78 3,78 |
 -2,55 -2,55 |
296 Medium |
| Total by TOP-10 companies |  74706 74706 |
 74420 74420 |
 1425 1425 |
 982 982 |
|||
| Average value by TOP-10 companies |  7471 7471 |
 7442 7442 |
 143 143 |
 98 98 |
 2,55 2,55 |
 2,16 2,16 |
|
| Industry average value |  121 121 |
 110 110 |
 2 2 |
 2 2 |
 2,50 2,50 |
 2,74 2,74 |
|
 — improvement of the indicator to the previous period,
  — decline in the indicator to the previous period.
The average value of the return on sales ratio of TOP-10 companies is below the industry average one and practical value. Three companies improved the result in 2017.
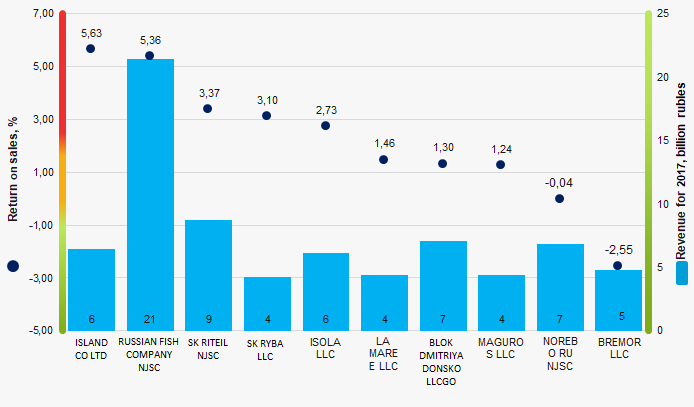 Picture 1. Return on sales ratio and revenue of the largest Russian wholesalers of fish and seafood (TOP-10)
The industry average indicators of the return on sales ratio have a downward trend over the course of 10 years (Picture 2).
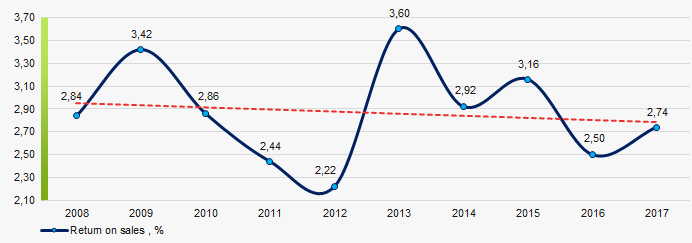 Picture 2. Change in the industry average values of the return on sales ratio of Russian wholesalers of fish and seafood in 2008 – 2017