
Order a report
Custom-made industry research, company ratings, competitor analysis


Transformation in the global banking sector
We are witnessing a rapid transformation in the global banking sector: in Top-20 of global commercial banks by assets, first four places are held by Chinese banks (table 1). Until recently, it was difficult to imagine as the palm historically belonged exclusively to credit institutions in Western Europe, USA and partly Japan.
According to 2017 results, the total assets of the world's commercial banks amounted to 116,4 trillion USD, 33% or 3 7,9 trillion USD of total assets correspond to Top-20 banks.
As of today, the leader of banking sector is Industrial & Commercial Bank of China (The) – ICBC with assets of 3.8 trillion USD. It is almost 1.8 times ahead of the largest US Bank in terms of assets - JPMorgan Chase Bank (5th place).
The largest bank in Eastern Europe is Sberbank of Russia, it takes the 54th place.
| № | Bank name | Country | Commercial banks total assets, bln USD |
| 1 | Industrial & Commercial Bank of China (The) - ICBC | China | 3784 |
| 2 | China Construction Bank Corporation Joint Stock Company | China | 3398 |
| 3 | Agricultural Bank of China Limited | China | 3233 |
| 4 | Bank of China Limited | China | 2990 |
| 5 | JPMorgan Chase Bank, NA | USA | 2141 |
| 6 | MUFG Bank Ltd | Japan | 1999 |
| 7 | Japan Post Bank Co Ltd | Japan | 1984 |
| 8 | Bank of America, National Association | USA | 1752 |
| 9 | Wells Fargo Bank, NA | USA | 1747 |
| 10 | Sumitomo Mitsui Banking Corporation | Japan | 1610 |
| 11 | BNP Paribas | France | 1575 |
| 12 | Mizuho Bank Ltd | Japan | 1546 |
| 13 | Barclays Bank Plc | United Kingdom | 1520 |
| 14 | Deutsche Bank AG | Germany | 1478 |
| 15 | Societe Generale SA | France | 1418 |
| 16 | Bank of Communications Co. Ltd | China | 1388 |
| 17 | Citibank NA | USA | 1385 |
| 18 | Hongkong and Shanghai Banking Corporation Limited (The) | Hong Kong | 1017 |
| 19 | Toronto Dominion Bank | Canada | 996 |
| 20 | Industrial Bank Co Ltd | China | 985 |
| 54 | Sberbank | Russia | 402 |
| Total | 116419 |
Almost 27% of total global bank assets correspond to Chinese banks - 30,9 trillion USD (picture 1). The USA share was reduced to 14% or 16,8 trillion USD. Another 15% are accumulated by banks in France (6,8 trillion USD), United Kingdom (6 trillion USD), Germany (2,9 trillion USD) and Spain (2,3 trillion USD).
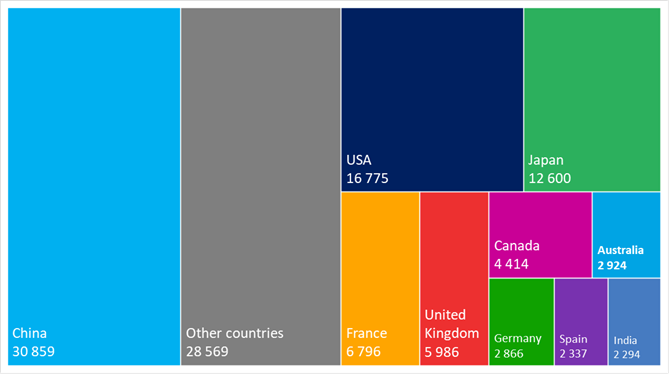 Picture 1. Distribution of commercial banks total assets by countries, bln USD, 2017
 Despite the fact that the assets are constantly increasing, the Russian banking sector takes the 17th place in the world. This is 1,2 trillion USD in absolute terms and it does not correspond to the size and development needs of the domestic economy and leads to a large dependence of domestic companies on international loans.