Ranking
TOP-10 of regions by the share of small business

In the countries with the modern economic structure, over 50% of work force is employed in small and medium-sized enterprises. In Russia, this figure is 22%. In 2018, the share of small business in total revenue of companies (including large) was 27,9%.

Contribution of small companies to the GDP is obviously insufficient. Russia is still the country of large corporations and monopoly, and therefore there are artificially high prices and lack of fair competition.

The Government is seeking to bring the GDP share in the economy to the level of developed countries up to 2025. However, there are already regions in Russia with the regional GDP financing mainly by small and medium-sized business.

The Republic of Dagestan with small business’ total share of 75,7% is ranked the first. This fact is due to the traditional economy of the region, where the population is involved in personal subsidiary economy and handicraft industry. Large business is slightly spread because of unavailability of rich natural recourses and effective demand. The similar situation prevails in neighboring North Caucasus republics (see Table 1).

TOP-10 also includes Ivanovo region (72,5%), Sevastopol (65,3%), Kirov region (56%) and Zabaikalye territory (55,5%).

Despite the high share of small business in the leading regions, the absolute contribution of small business is minimal: 1,7 trillion RUB compared to 59,9 trillion RUB for the whole country.

Table 1. TOP-10 of regions with the highest share of small business in the total turnover in 2018, %
Region Small business’ share in total turnover of companies, % Small business’ turnover, billion RUB Total turnover of companies, billion RUB
1 Republic of Dagestan 75,7 308 406
2 Ivanovo region 72,5 425 586
3 Sevastopol 65,3 81 125
4 Kabardino-Balkarian Republic 62,2 75 121
5 Chechen Republic 61,5 109 177
6 Republic of Ingushetia 61,0 16 26
7 Republic of North Ossetia-Alania 58,9 64 108
8 Kirov region 56,0 333 595
9 Republic of Adygea 55,5 90 162
10 Zabaikalye territory 55,5 211 381
  Russian Federation 27,9 59 936 214 562

Source: ЕМИСС, Unified interdepartmental statistical information system, Rosstat, calculations of Credinform based on the System Globas

The highest turnover of small business in absolute figures is recorded for Moscow - 16,7 trillion in 2018. However, the share of small business in total turnover of companies slightly exceeded 25%.

Novosibirsk region is ranked the fourth with the highest share of small business in the regional economy – 50,5% (see Picture 1).

Picture  1. Small business’ share in the regions with the highest turnover of small and medium-sized business 
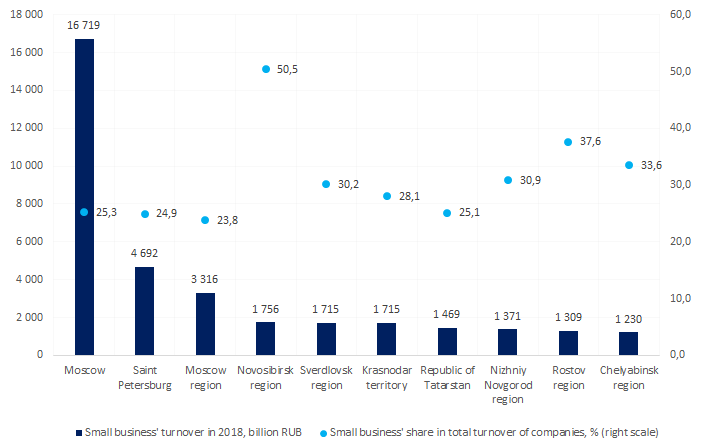
Рисунок 1. Small business’ share in the regions with the highest turnover of small and medium-sized business

The priority is to increase the contribution of small business to the GDP, and it is involved stable and continued development of the economy, fair competition and entering new selling markets. However, lack of plans to reduce the tax burden, cancellation of single tax on imputed income from 2021, huge fiscal injections to the large state-owned companies to the detriment of small companies – all these call into question the achievement of the goal.

Article
Trends in hotel industry

Information agency Credinform has observed trends in the activity of the enterprises of hotel industry of the 10 largest Russian cities.

Enterprises of hotel industry with the largest volume of annual revenue (TOP-1000) were selected for the analysis, according to the data from the Statistical Register for the latest available periods (for 2014-2018). The analysis was made on the basis of the data of the Information and Analytical system Globas.

Net assets is an indicator, reflecting the real value of company's property, is calculated annually as the difference between assets on the enterprise balance and its debt obligations. The indicator of net assets is considered negative (insufficiency of property), if company’s debt exceeds the value of its property.

The largest company in terms of net assets amount is LLC INTUR-HOTEL, INN 7702729622, Moscow. The company is in process of reorganization in the form of acquisition since 29.05.2019 and belongs to the AZIMUT group. In 2018 net assets of the enterprise amounted to 9 billion RUB.

LLC SKI RESORT DEVELOPMENT COMPANY ROSA KHUTOR , INN 7702347870, Moscow, had the smallest amount of net assets in the TOP-1000 group. Insufficiency of property of the company in 2018 was expressed in negative value -47,2 million RUB.

For a five-year period average amount of net assets of TOP-1000 companies has increasing tendency (Picture 1).

Picture 1. Change in average indicators of the net asset amount of TOP-1000 companies in 2014 – 2018 Picture 1. Change in average indicators of the net asset amount of TOP-1000 companies in 2014 – 2018

Share of companies with insufficiency of property in the TOP-1000 was on high level with decreasing tendency for the last five years (Picture 2).

Picture 2. Shares of companies with negative values of net assets in TOP-1000 companies Picture 2. Shares of companies with negative values of net assets in TOP-1000 companies

Sales revenue
The revenue volume of 10 leaders of the industry made 22% of the total revenue of TOP-1000 companies in 2018 (Picture 3). It demonstrates high level of competition in the industry.

Picture 3. Shares of participation of TOP-10 companies in the total revenue of TOP-1000 companies for 2018 Picture 3. Shares of participation of TOP-10 companies in the total revenue of TOP-1000 companies for 2018

In general, an increasing tendency in revenue volume is observed (Picture 4).

Picture 4. Change in the average revenue of manufacturers of pharmaceuticals and medical products in 2014 – 2018 Picture 4. Change in the average revenue of manufacturers of pharmaceuticals and medical products in 2014 – 2018

Profit and losses
The largest company in terms of net profit amount is LLC VYSOTKA, INN 7730121138 (hotel «Ukraina»). Net profit of the company amounted to more than 957 million RUB for 2018.

For the last five years average indicators of net profit for TOP-1000 group have an increasing tendency (Picture 5).

Picture 5. Change in the average indicators of net profit of TOP-1000 companies in 2014 – 2018 Picture 5. Change in the average indicators of net profit of TOP-1000 companies in 2014 – 2018

Over a five-year period, the average values of net profit indicators of TOP-1000 companies tend to increase. Besides, the average value of net loss decreases (Picture 6).

Picture 6. Change in the average indicators of net profit and loss of TOP-1000 companies in 2014 – 2018 Picture 6. Change in the average indicators of net profit and loss of TOP-1000 companies in 2014 – 2018

Key financial ratios
Over the five-year period the average indicators of the current liquidity ratio of TOP-1000 in general were within the range of recommended values – from 1,0 up to 2,0 with increasing tendency (Picture 7).

The current liquidity ratio (the relation of the amount of current assets to short-term liabilities) shows the sufficiency of company’s funds for repayment of its short-term liabilities.

Picture 7. Change in the average values of the current liquidity ratio of TOP-1000 companies in 2014 – 2018 Picture 7. Change in the average values of the current liquidity ratio of TOP-1000 companies in 2014 – 2018

High level of the average values of the indicators of the return on investment ratio with decreasing tendency have been observed for five years (Picture 8).

The ratio is calculated as the relation of net profit to the sum of own capital and long-term liabilities and demonstrates the return on the equity involved in the commercial activity of own capital and the long-term borrowed funds of an organization.

Picture 8. Change in the average values of the return on investment ratio of TOP-1000 companies in 2014 – 2018 Picture 8. Change in the average values of the return on investment ratio of TOP-1000 companies in 2014 – 2018

Asset turnover ratio is calculated as the relation of sales revenue to the average value of total assets for a period and characterizes the efficiency of use of all available resources, regardless of the sources of their attraction. The ratio shows how many times a year a complete cycle of production and circulation is made, yielding profit.

This business activity ratio showed a tendency to increase for a five-year period (Picture 9).

Picture 9. Change in the average values of the assets turnover ratio of TOP-1000 companies in 2014 – 2018 Picture 9. Change in the average values of the assets turnover ratio of TOP-1000 companies in 2014 – 2018

Small business
81% of the TOP-1000 companies are registered in the Register of small and medium enterprises of the Federal Tax Service of the RF. Besides, share of revenue in the total volume is 30%, that is significantly higher than the average indicator countrywide (Picture 10).

Picture 10. Shares of small and medium enterprises in TOP-1000 companies, % Picture 10. Shares of small and medium enterprises in TOP-1000 companies, %

Main regions of activity
TOP-1000 enterprises that registered in 10 largest cities are unequally distributed along the territory of Russia. More than 86% are located in Moscow and Saint Petersburg (Picture 11).

Picture 11. Distribution of revenue TOP-1000 companies by 10 largest cities of Russia Picture 11. Distribution of revenue TOP-1000 companies by 10 largest cities of Russia

Financial position score
An assessment of the financial position of TOP-1000 companies shows that the largest number is in an average financial position. (Picture 12).

Picture 12. Distribution of TOP-1000 companies by financial position score Picture 12. Distribution of TOP-1000 companies by financial position score

Solvency index Globas
Most of TOP-1000 companies have got from Medium to Superior Solvency index Globas, that points to their ability to repay their debts in time and fully (Picture 13).

Picture 13. Distribution of TOP-1000 companies by solvency index Globas Picture 13. Distribution of TOP-1000 companies by solvency index Globas

Conclusion
Comprehensive assessment of the activity of the enterprises of hotel industry of the 10 largest Russian cities, taking into account the main indexes, financial indicators and ratios, demonstrates the presence of favorable trends (Table 1)

Table 1. Positive and negative trends, assessment factors of TOP-1000
Trends and assessment factors Share of factor, %
Rate of increase (decrease) of average amount of net assets down-10
Increase / decrease of share of companies with negative values of net assets up5
Level of competition/monopolization up10
Increase (decrease) rate of average revenue amount up10
Increase (decrease) rate of average net profit (loss) amount up10
Increase / decrease of average net profit amount of TOP-1000 companies up10
Increase / decrease of average net loss amount of TOP-1000 companies up10
Increase / decrease of average industrial values of the current liquidity ratio up5
Increase / decrease of average industrial values of the return on investments ratio down-5
Increase / decrease of average industrial values of the assets turnover ratio, times up10
Share of small and medium enterprises in the industry in terms of revenue volume more than 22% up10
Regional concentration down-10
Financial position (major share) up5
Solvency index Globas (major share) up10
Average value of factors up5,0

Up positive trend (factor), Down negative trend (factor).