Fertilizers production trends
From December 2021 to May 2022 according to the Russian Federation Decree of 03.11.2021 No 1910 nitrogenous fertilizers export quota is set. It is associated with world gas prices rise in compliance with rise of prices of fertilizers with proportion of gas up to 80%. This measure will help to prevent shortage of fertilizers on the Russian market, especially taking into account the negative trends in the activities of the largest domestic producers in the recent years.
The most important of them are: high level of monopolization, growth in loss and decreasing tendency in the industrial production index for the past 12 months. Among positive trends there are decrease in shares of the companies with insufficient property, growth in revenue and increase in ROI ratio.
For this analysis information agency Credinform selected the largest companies producing fertilizers and nitrogen compounds (TOP 100) in terms of annual revenue according to the data from the Statistical Register and the Federal Tax Service for the latest available periods (2015-2020). The analysis was based on the data of the Information and Analytical system Globas.
Net assets are total assets less total liabilities. This indicator reflects the real value of the property of an enterprise. When the company’s debt exceeds the value of its property, the indicator is considered negative (insufficiency of property).
The largest company in term of net assets is EUROCHEM - USOLSKY POTASH COMPLEX, INN 5911066005, Perm Territory. In 2020 net assets of the company exceeded 157 billion RUB.
The lowest net assets value among TOP 100 belonged to JSC UNITED CHEMICAL COMPANY URALCHEM, INN 7703647595, Moscow. Insufficient property figured out negative value -109 billion RUB.
For the five-year period the average net assets values of TOP 100 tend to increase with decreasing rate of its growth. (Picture 1).
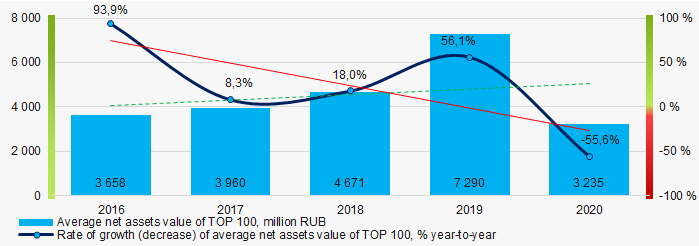 Picture 1. Change in average net assets value of TOP 100 in 2016– 2020
Shares of the companies with insufficient property had a positive trend to decrease. (Picture 2).
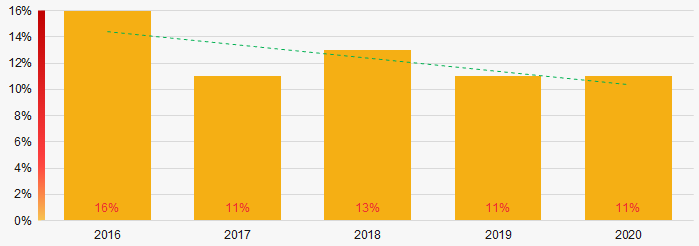 Picture 2. Shares of TOP 100 companies with negative net assets value in 2016-2020
Sales revenue
In 2020, the revenue volume of the ten largest companies was about 87% of total TOP 100 revenue (Picture 3). This indicates a high level of monopolization in the industry.
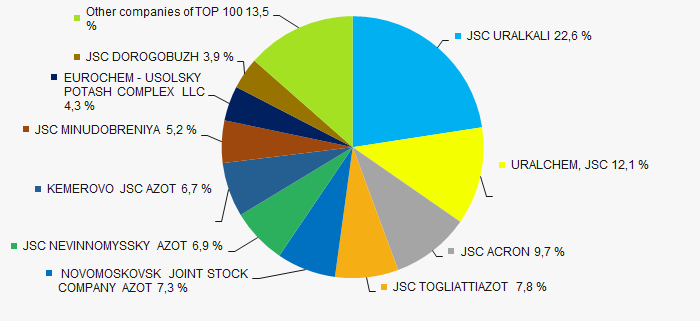 Picture 3. The share of TOP 10 companies in total 2020 revenue of TOP 100
 For five years average revenue values of TOP 100 and rates of its growth increase with every year. (Picture 4).
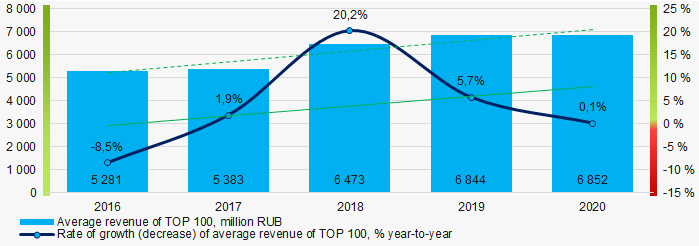 Picture 4. Change in average net profit of TOP 100 in 2016 – 2020
Profit and loss
In 2020, the largest organization in term of profit was also EUROCHEM - USOLSKY POTASH COMPLEX. The company’s profit exceeded 13 billion RUB.
For the five-year period there is a trend to decrease in average net profit of TOP 100. (Picture 5).
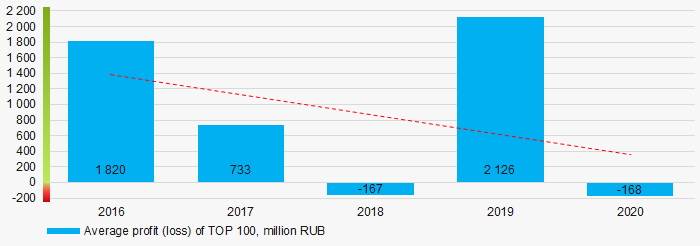 Picture 5. Change in average profit (loss) of TOP 100 in 2016 - 2020
For the five-year period average net profit of TOP 100 have a decreasing trend with increasing net loss (Picture 6).
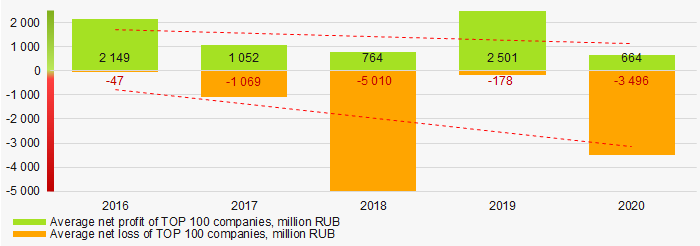 Picture 6. Change in average net profit and average net loss of TOP 100 companies in 2016 - 2020
Key financial ratios
For the five-year period average values of current liquidity ratio of TOP 100 were mostly above the recommended one - from 1,0 to 2,0 with a trend to decrease. (Picture 7).
Current liquidity ratio (current assets to short-term liabilities) shows the sufficiency of company’s assets to repay on short-term liabilities.
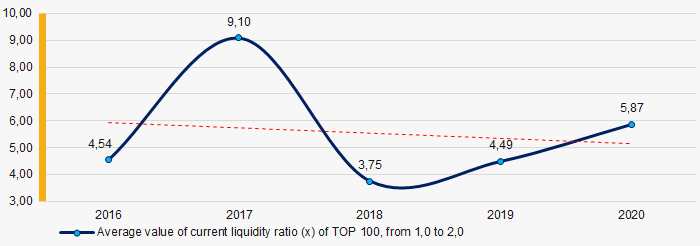 Picture 7. Change in average value of current liquidity ratio of TOP 100 in 2016 - 2020
For the five-year period average values of ROI ratio of TOP 100 were on the high level and showed increasing trend. (Picture 8).
ROI ratio is calculated as net profit to sum of shareholders equity and long-term liabilities, and shows the return of equity involved in commercial activities and long-term borrowed funds.
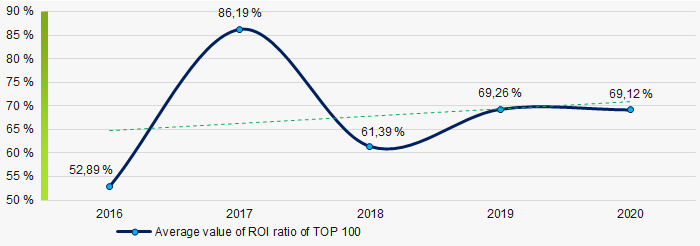 Picture 8. Change in average value of ROI ratio of TOP 100 in 2016 - 2020
Assets turnover ratio is the ratio of sales revenue and company’s average total assets for a period. It characterizes the effectiveness of using of all available resources, regardless the source of their attraction. The ratio shows how many times per year the full cycle of production and circulation is performed, generating the corresponding effect in the form of profit.
For the five-year period average values of assets turnover ratio of TOP 100 had a trend to decrease. (Picture 9).
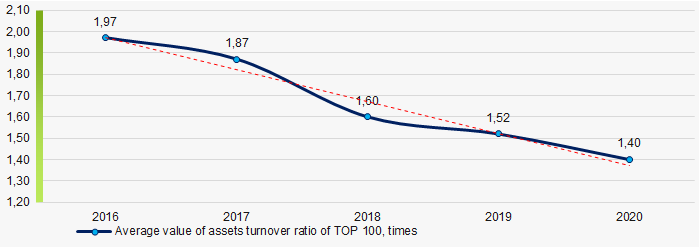 Picture 9. Change in average value of assets turnover ratio of TOP 100 in 2016 – 2020
Small business
80% of the TOP 100 companies are registered in the Register of small and medium-sized enterprises of the Federal Tax Service of the Russian Federation. Moreover their share in total revenue of the TOP 100 in 2020 is only 1,7% that is way below the average values over the country in 2018 - 2019. (Picture 10).
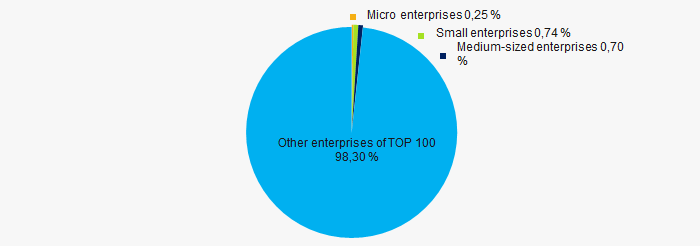 Picture 10. Shares of small and medium-sized enterprises in TOP 100
Main regions of activity
Companies of TOP 100 are registered in 38 regions of Russia (45% of the constituent entities of the Russian Federation), and unequally located across the country due to the specifics of raw materials sources geographical location. More than 49% of total revenue of TOP 100 companies in 2020 are located in Perm Territory, Moscow and Novgorod Region. (Picture 11).
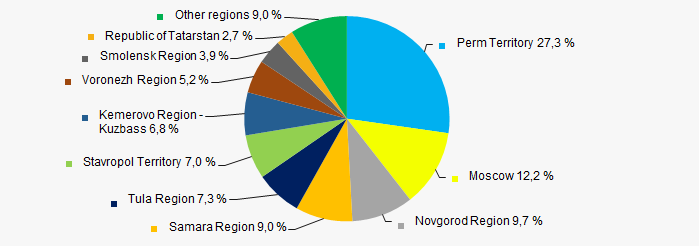 Picture 11. Distribution of TOP 100 revenue by regions of Russia
Financial position score
Assessment of the financial position of TOP 100 companies shows that the majority of them have average financial position (Picture 12).
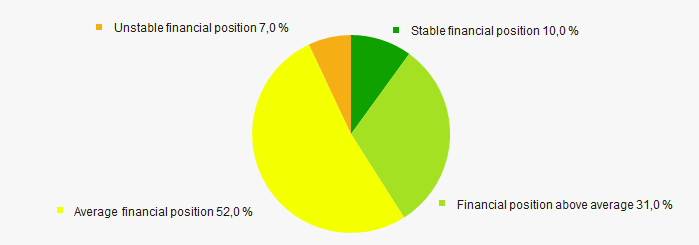 Picture 12. Distribution of TOP 100 companies by financial position score
Solvency index Globas
Most of TOP 100 companies got Superior / High indexes Globas. This fact shows their ability to meet their obligations on time and in full (Picture 13).
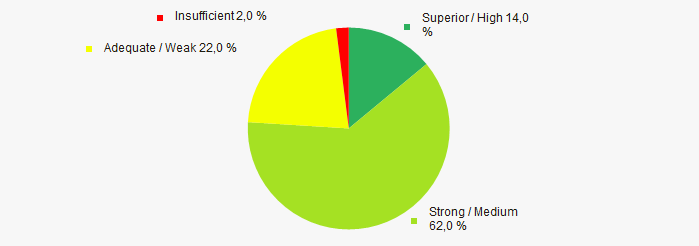 Picture 13. Distribution of TOP 100 companies by Solvency index Globas
Industrial production index
According to the Statistical Register data, for 12 months in 2020 – 2021 there is a decrease in values of pesticides and agrochemicals industrial production index. (Picture 14). However, average value of the index month over month was 105.6%.
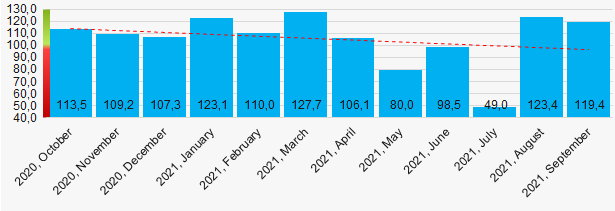 Picture 14. Pesticides and agrochemicals industrial production index in 2020 - 2021, month over month (%)
Conclusion
Complex assessment of activity of the largest fertilizers producers demonstrates the prevalence of negative trends in 2016 - 2020 (Table 1).
| Trends and evaluation factors | Relative share of factors, % |
| Dynamics of the average net assets value |  10 10 |
| Rate of growth (decline) in the average size of net assets |  -10 -10 |
| Increase / decrease in the share of enterprises with negative values of net assets |  10 10 |
| Level of competition / monopolization |  -10 -10 |
| Dynamics of the average revenue |  10 10 |
| Rate of growth (decrease) in the average size of revenue |  10 10 |
| Dynamics of the average profit (loss) |  -10 -10 |
| Growth / decline in average values of companies’ net profit |  -10 -10 |
| Growth / decline in average values of companies’ net loss |  -10 -10 |
| Increase / decrease in average values of total liquidity ratio |  -5 -5 |
| Increase / decrease in average values of return on investment ratio |  10 10 |
| Increase / decrease in average values of asset turnover ratio, times |  -10 -10 |
| Share of small and medium-sized businesses in terms of revenue being more than 20% |  -10 -10 |
| Regional concentration |  -5 -5 |
| Financial position (the largest share) |  5 5 |
| Solvency index Globas (the largest share) |  10 10 |
| Average industrial production index for 12 months, month over month more than 100% |  10 10 |
| Dynamics of the industrial production index for 12 months |  -10 -10 |
| Average value of relative share of factors |  -0,8 -0,8 |
 positive trend (factor),
  negative trend (factor)
Legislative changes
The State Duma of the Federal Assembly of the Russian Federation of the eighth convocation has been working since October 12, 2021. During the past period, five Federal laws have been adopted and signed by the President of the Russian Federation, 3 laws have been sent to the Federation Council for approval, 73 bills have been sent for feedback and 22 for amendments. We offer an overview of the draft laws in the economic field currently under consideration in the State Duma.
By the second reading, draft Federal Law №1258306-7 mitigated previously planned deoffshorization measures. In order to limit the possibility of obtaining state support in the form of subsidies and budget investments by companies whose owners are registered in offshore zones, it is proposed to reduce the possibility of direct or indirect, i.e. through third parties, offshore ownership in the authorized capital of these legal entities from 50% to 25%. In addition, when determining the share owned by offshore owners, it is proposed not to take into account shares traded at organized auctions.
The draft Federal Law №1159731-7 on amendments to the law "On Accounting", which is under consideration in the second reading, proposes:
- to limit the range of organizations exempt from reporting to the State Information Resource of Financial Accounts (GIRBO);
- to empower the Government of the Russian Federation to determine cases in which access to information from GIRBO may be temporarily or permanently restricted for certain categories of users;
- to establish a single deadline for submitting corrected reports to GIRBO;
- to clarify the composition of the information to be placed by organizations in the Unified Federal Register of Legally Significant Information about activities of Legal Entities, individual entrepreneurs and other subjects of economic activity.
In the first reading, draft laws are being reviewed providing for:
- preparation by the Government of the Russian Federation of proposals on the formation of a list of strategically important organizations of the military-industrial complex, which are submitted to the President of the Russian Federation for approval. It is supposed to establish special requirements for the possibility of alienation or transfer to trust management of shares or shares in the authorized capital of organizations that have strategic importance for the military-industrial complex and the security of the country;
- elimination of the main legal conflicts and obstacles for joint-stock companies of employees (people's enterprises) to operate normally;
- mitigating restrictions on obtaining support by small and medium-sized enterprises that have committed minor violations of the procedure and conditions for providing support;
- elimination of a number of administrative barriers in the form of obtaining mandatory approvals for transactions aimed at restoring the previously lost control of the beneficial owner over a foreign company in the event of its registration as an international company in the special administrative regions of Russia.
Draft Federal Law №1256483-7 "On Financial groups and financial holdings" is under preliminary consideration. The Law is supposed to introduce the concepts of a financial group, a financial holding company and the conditions under which associations of legal entities are recognized as financial groups or holdings. Thus, as a general rule, a financial group may be recognized as an association of legal entities under the control or significant influence of a financial organization, and a financial holding is an association of legal entities under the control of a non-financial organization, one of the participants of which is a financial organization, and the share of financial activities which is at least 40%.