
Order a report
Custom-made industry research, company ratings, competitor analysis


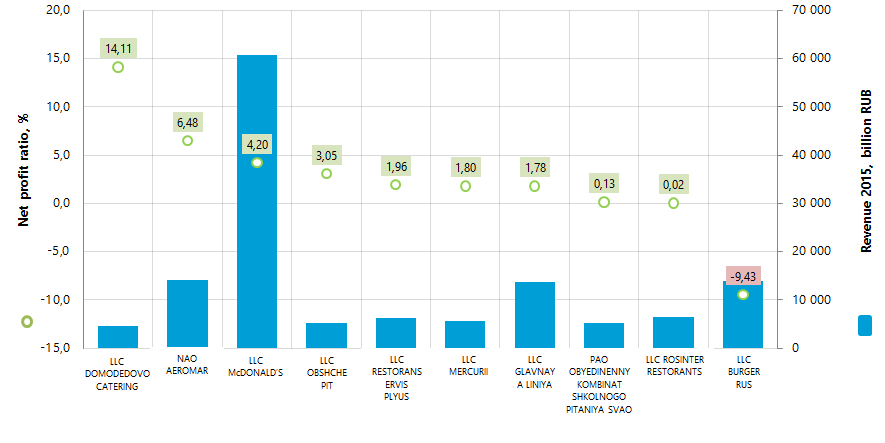
Net profit ratio of the largest public catering enterprises in Russia
Information agency Credinform has prepared the ranking of the largest public catering enterprises in Russia on the net profit ratio.
Earlier we referred to enterprises of this industry in our publications: “Return on assets of restaurant business”.
Enterprises having the largest revenue (TOP-10) for the last available in the Statistical register period (2015) and operating on the public catering market no less than three years were taken for the ranking. Further, they were ranked in the descending order of the net profit ratio (Table 1).
The net profit ratio (%) is calculated as a ratio of the net profit (loss) to sales revenue. The ratio shows the rate of companies’ sales profit.
There aren’t any standard values of the indicator. It is recommended to compare companies belonging to one industry or change of the ratio with time by a certain enterprise.
The negative value of the indicator shows that there is a net loss. The more the value of indicator is, the more effective the enterprise works.
In order to get the full and fair picture of the company’s financial situation, it is necessary to pay attention to all the available complex of ratios, financial and other indicators.
| Name | Net profit 2015, mln RUB | Revenue 2015, mln RUB | Revenue 2015 to 2014, (increase / decrease), % | Net profit ratio, % | Solvency index Globas-i |
|---|---|---|---|---|---|
| LLC DOMODEDOVO CATERING Tax number 5009097155 Moscow region |
651,9 | 4 621,2 | -22,1 | 14,11 | 238 High |
| NAO AEROMAR Tax number 7712045131 Moscow region |
909,3 | 14 031,4 | 23,9 | 6,48 | 148 Prime |
| LLC McDONALD’S Tax number 7710044140 Moscow |
2 548,5 | 60 639,0 | 14,6 | 4,20 | 186 Prime |
| LLC OBSHCHEPIT Tax number 7801589077 Saint-Petersburg |
159,2 | 5 215,5 | -3,8 | 3,05 | 261 High |
| LLC RESTORANSERVIS PLYUS Tax number 7802210076 Saint-Petersburg |
120,4 | 6 150,8 | 30,5 | 1,96 | 190 Prime |
| LLC MERCURII Tax number 7801589084 Saint-Petersburg |
102,0 | 5 668,4 | 16,4 | 1,80 | 244 High |
| LLC GLAVNAYA LINIYA Tax number 7728751238 Moscow |
244,4 | 13 702,9 | 27,8 | 1,78 | 256 High |
| PAO OBYEDINENNY KOMBINAT SHKOLNOGO PITANIYA SVAO Tax number 7716771303 Moscow |
7,0 | 5 207,0 | 121,3 | 0,13 | 238 High |
| LLC ROSINTER RESTORANTS Tax number 7737115648 Moscow |
1,1 | 6 454,7 | -10,0 | 0,02 | 224 High |
| LLC BURGER RUS Tax number 7719723690 Moscow |
-1 316,2 | 13 955,5 | 34,7 | -9,43 | 306 Satisfactory |
In 2015 the average value on the net profit ratio in the group of companies TOP-10 amounted to 2,41. The same indicator in the group of companies TOP-100 amounted to 1,7, while the industry-average value is 4,15.
Nine companies of the TOP-10 were given high and prime solvency index Globas-i, which bears evidence to their ability to meet debt obligations timely and in full.
LLC BURGER RUS was given satisfactory index Globas-i due to information about being a defendant in debt collection arbitration proceedings, unclosed writs of execution and loss in the balance sheet figures.
The total revenue of the TOP-10 in 2015 amounted to 135,6 billion RUB, which is by 18% more than in 2014. At the same time the total net profit in this group of companies decreased by 31%. Seven companies of the TOP-10 tolerated decrease of net profit amount in 2015 in comparison with the previous period, and three companies also decreased the revenue amount.
In group of companies TOP-100 the increase of the total revenue for the same period amounted to 26%, during decreasing of the total net profit by 64%.
Nine companies of the TOP-10, as the industry in the whole, have the positive values of the net profit ratio. It refers to higher profitability of the industry operation. However, there is a visible trend to growth rate reduction in recent years. It is confirmed by the data of the Federal State Statistics Service (Rosstat) (Figure 2).
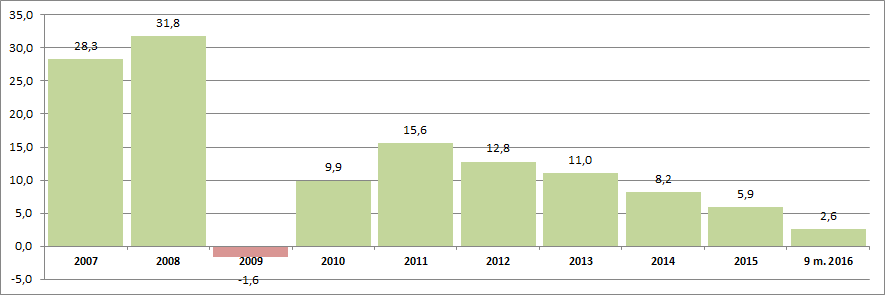
The total sales revenue amounting to 548 billion RUB in 2007 increased by 2015 by 2,4 times and amounts to 1 305 billion RUB.
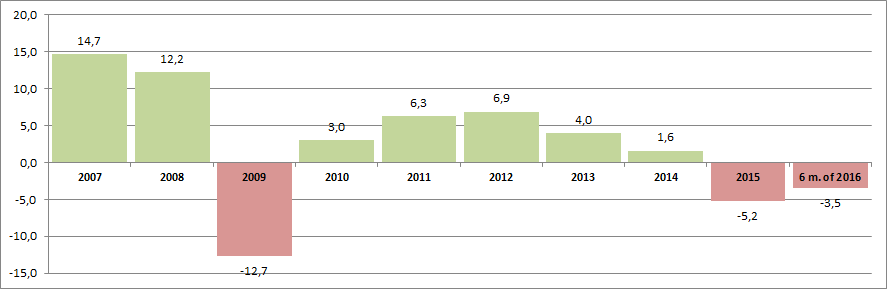
According to the same data of the Rosstat, at the stated period the index of actual turnover volume of public catering has also a trend to decrease over the last years (Figure 3).
The public catering enterprises gravitate to a significant extent to the largest country’s agglomerations – Moscow and Saint-Petersburg. It is confirmed by the data of Information and Analytical system Globas-i, according to which 100 public catering enterprises largest by the revenue volume for 2015 are located in 22 regions of Russia.
| Region | Number of registered companies |
|---|---|
| Moscow | 46 |
| Saint-Petersburg | 17 |
| Moscow region | 9 |
| Republic of Tatarstan | 3 |
| Irkutsk region | 2 |
| Kemerovo region | 2 |
| Krasnoyarsk Territory | 2 |
| Perm Territory | 2 |
| Saratov region | 2 |
| Sverdlovsk region | 2 |
| Khanty-Mansiisk autonomous district - Yugra | 2 |
Thus 63% of the industry-largest companies are situated in Moscow and Saint-Petersburg.