
Order a report
Custom-made industry research, company ratings, competitor analysis


Russia’s foreign trade turnover is decreasing
Troublesome geopolitical environment in Ukraine generated the deterioration in relations between Russia and Western countries, primarily with USA and EU. This took the form of the mutual sanction policy application. Financial and commodity restrictions have already had a negative impact on dynamic of Russia’s foreign trade turnover.
Russia’s foreign trade volume over January – August 2014 amounted to USD 520,6 billion, that is 4,4% lower in comparison with the corresponding period of the previous year (USD 544,5 billion). Moreover, the decrease of the goods turnover with the EU countries was more significant – 5,7%.
Out of the whole turnover in monetary terms, import accounts for USD 189,1 billion (36,3%), export - USD 331,4 billion (63,7%). Thus, the trade surplus amounted to USD 142,3 billion, having increased on 3,7% to the level of January – August 2013. The increase of surplus was in the first place influenced by the decrease of import volume on 7,1% within 8 months of this year, whereas export decreased on 2,8%.
In spite of the western countries’ sanctions and the food embargo, imposed on August 7th against EU, USA and some other countries (under seizure are grocery products, including fruits that have only 2% in the total import volume), the European Union is still the main foreign trade partner of the Russian Federation: 28 countries of the economic bloc generate in the whole 49.3% of our trade (USD 256,2 billion over January – August 2014); Russia is a third in order of importance EU partner after the USA and China.
| № | Country | Foreign trade turnover over January-August 2013, million USD | Foreign trade turnover over January-August 2014, million USD | Change, % | Share of the country in the total turnover |
|---|---|---|---|---|---|
| 1 | China | 57 138,1 | 57 161,0 | 0,0 | 11,0 |
| 2 | The Netherlands | 50 602,8 | 51 620,1 | 2,0 | 9,9 |
| 3 | Germany | 47 694,5 | 44 610,2 | -6,5 | 8,6 |
| 4 | Italy | 35 151,6 | 33 920,6 | -3,5 | 6,5 |
| 5 | Ukraine | 24 637,1 | 21 767,2 | -11,6 | 4,2 |
| 6 | Japan | 21 173,2 | 20 555,9 | -2,9 | 3,9 |
| 7 | The United States of America | 17 397,2 | 20 320,0 | 16,8 | 3,9 |
| 8 | Turkey | 20 837,9 | 20 087,5 | -3,6 | 3,9 |
| 9 | Belarus | 23 202,1 | 18 854,0 | -18,7 | 3,6 |
| 10 | Republic of Korea | 15 861,6 | 18 332 ,8 | 15,6 | 3,5 |
In respect to isolated countries (table 1), China holds the first place in mutual trade with the RF, following the results of 8 months. Total money turnover reached USD 57,2 billion. In spite of sanctions and prospects of decreasing the collaboration, the USA accumulated the trade turnover with our country on almost 16,8%, to USD 20,3 billion over analyzed period. It is the largest increment among TOP-10 partner countries. The good dynamic is also observed in trade increase with the South Korea – on 15,6%.
The largest decline of trade volume was fixed with the Republic of Belarus (-18,7%) and Ukraine (-11,6%). It is worth noting that the crisis situation in Ukraine is far from the completion. And ratification association contract with the EU will lead to the fact that Russia will have to introduce duties on the Ukrainian products. The cessation of gas deliveries, mutual extra sanctions, destroyed infrastructure of Donets Basin, general decline in industrial production will in the short term cause even greater trade decline with our neighbor. Ukraine is in danger of total corroding of all the ties and losing of the main for the country Russian market.
The trade decline with Belarus is explained largely by the fact that supplies of the Ukrainian products were carried out through this country as well.
Our export commodity structure (fig. 1) still basically consists of the mineral resources - 71,1% of the whole goods turnover in January-August 2014 (USD 235,6 billion). Out of TOP-10 commodity items (table 2) the export of cereals has increased more than others – on 80,1% in monetary terms. It happened owing to the good grain yield. The export of the main resource – oil and gas has decreased on 2,7%.
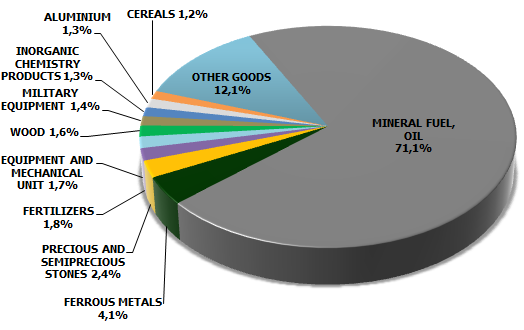
Figure 1. Export commodity structure in January-August 2014, % in the total volume in monetary terms
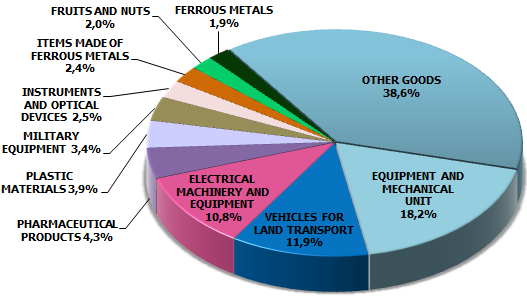
Figure 2. Import commodity structure in January-August 2014, % in the total volume in monetary terms
The import commodity structure (fig.2) is much more diversified: 18,2% of the money turnover accounts for machinery and equipment (USD 34,4 billion), 11,9% - vehicles for land transport (including cars), 10,8% - electrical machinery and equipment.
| № | Name of export item | Trade volume, USD million | Change, % | Name of import item | Trade volume, USD million | Change, % |
|---|---|---|---|---|---|---|
| 1 | Mineral fuel, oil | 235 558,9 | -2,7 | Equipment and mechanical unit | 34 449,7 | -7,1 |
| 2 | Ferrous metals | 13 473,3 | 2,2 | Vehicles for land transport | 22 512,5 | -15,5 |
| 3 | Pearl, precious or semiprecous stones | 8 104,9 | -10,1 | Electrical machinery and equipment | 20 478,9 | -5,3 |
| 4 | Fertilizers | 5 855,3 | -8,4 | Pharmaceutical products | 8 223,2 | -10,1 |
| 5 | Equipment and mechanical unit | 5 576,5 | 7,8 | Plastic materials | 7 331,5 | -3,3 |
| 6 | Wood | 5 189,3 | 10,6 | Military equipment | 6 523,9 | 56,6 |
| 7 | Military equipment | 4 580,1 | -28,0 | Instruments and optical devices | 4 771,5 | -15,2 |
| 8 | Inorganic chemistry products | 4 438,7 | -13,7 | Items made of ferrous metals | 4 482,0 | -17,7 |
| 9 | Aluminium | 4 410,1 | -9,3 | Fruits and nuts | 3 729,6 | -9,4 |
| 10 | Cereals | 4 017,8 | 80,1 | Ferrous metals | 3 623,6 | -11,2 |
Sanctions, imposed against our country, adversely affected the trade with our main partner – EU that has already spoken about possible repeal of some restrictive measures. Counter measures on the part of Russia gave rise to the fact that Europe loses the large market which can be in the short term filled by the suppliers from Asia and Latin America. Due to this, deficit or catastrophic declines of various commodities output supply are not expected. The market will quickly redevelop and stabilize.
Logistic complication of the North American shale gas delivery to the European continent and extremely fragile situation in the North Africa and Middle East bring to naught EU plans to abandon Russian energy carriers – the main income item of our export.