
Order a report
Custom-made industry research, company ratings, competitor analysis


Trends in the work of Saratov companies
Information agency Credinform represents an overview of activity trends of the largest companies in the real sector of the economy of Saratov region.
The enterprises with the largest volume of annual revenue of the real sector of the economy in Saratov region (TOP-1000) were selected for the analysis, according to the data from the Statistical Register for the latest available periods (2013-2017). The analysis was made on the basis of the data of the Information and Analytical system Globas.
Net assets is an indicator, reflecting the real value of the property of an enterprise. It is calculated annually as the difference between assets on the balance sheet of the enterprise and its debt obligations. The indicator of net assets is considered negative (insufficiency of property), if company’s debt exceeds the value of its property.
| № | Name, INN, type of activity | Net assets value, bln RUB | Solvency index Globas | ||||
| 2013 | 2014 | 2015 | 2016 | 2017 | |||
| 1 | 2 | 3 | 4 | 5 | 6 | 7 | 8 |
| 1 | Interregional Distribution Grid Company of Volga PJSC INN 6450925977 Power transmission and technological connection to distribution grids |
|
|
|
|
|
140 Superior |
| 2 | SARATOVSKII NEFTEPERERABATYVAYUSHCHII ZAVOD PJSC INN 6451114900 Production of petroleum products |
|
|
|
|
|
196 High |
| 3 | SARATOVNEFTEGAZ PJSC INN 6450011500 Provision of services in the field of oil and natural gas production |
|
|
|
|
|
263 Medium |
| 4 | GAZPROM TRANSGAZ SARATOV LLC INN 6453010110 Gas pipeline transportation |
|
|
|
|
|
218 Strong |
| 5 | SARATOVNEFTEPRODUCT PJSC INN 6452034165 Wholesale of solid, liquid and gaseous fuels and related products |
|
|
|
|
|
180 High |
| 996 | BALTEKS LLC INN 6440021299 Silk fabrics production |
|
|
|
|
|
339 Adequate |
| 997 | SARATOVSKAYA PRIGORODNAYA PASSAZHIRSKAYA KOMPANIYA NJSC INN 6452950802 Transportation of passengers by rail in intercity traffic |
|
|
|
|
|
256 Medium |
| 998 | GAZPROM MEZHREGIONGAZ SARATOV LLC INN 6450068585 Sale of gaseous fuels supplied through distribution networks |
|
|
|
|
|
264 Medium |
| 999 | Saratov Storage Tank Construction Works NJSC INN 6453009475 Manufacture of building metal structures, products and their parts Process of being wound up, 05.12.2017 |
|
|
|
|
|
600 Insufficient |
| 1000 | BALAKOVO-TSENTROLIT NJSC INN 6439076046 Iron casting |
|
|
|
|
|
324 Adequate |
![]() — growth of the indicator to the previous period,
— growth of the indicator to the previous period, ![]() — decline of the indicator to the previous period.
— decline of the indicator to the previous period.
The average values of net assets of TOP-1000 enterprises tend to increase over the five-year period (Picture 1).
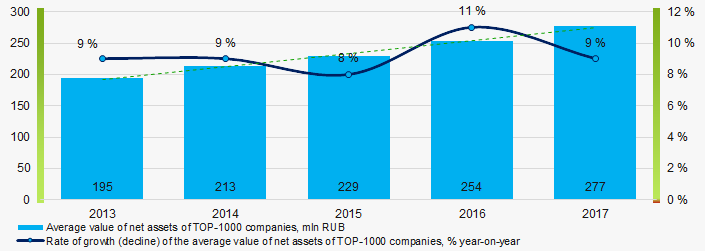 Picture 1. Change in the average indicators of the net asset value of TOP-1000 enterprises in 2013 – 2017
 The shares of TOP-1000 enterprises with insufficiency of assets have a tendency to increase in the last five years (Picture 2).
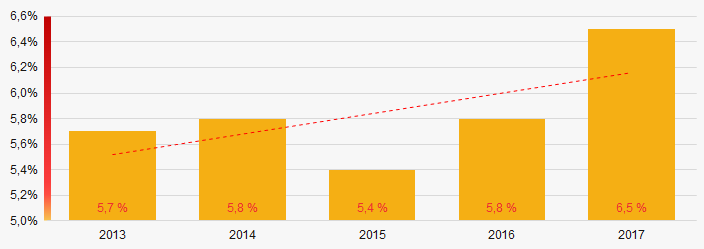 Picture 2. Shares of enterprises with negative values of net assets in TOP-1000
Sales revenue
The revenue volume of 10 leading companies of the region made 34% of the total revenue of TOP-1000. (Picture 3). It points to a relatively low level of capital concentration in Saratov region.
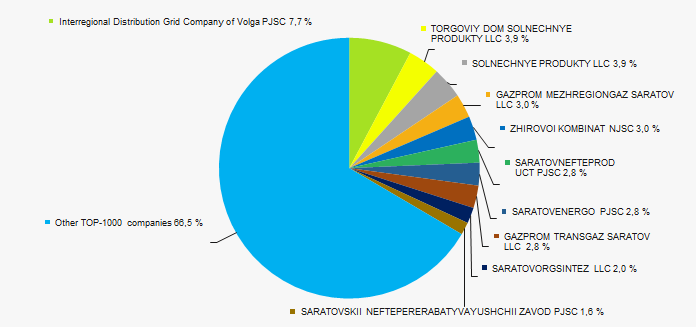 Picture 3. Shares of participation of TOP-10 companies in the total revenue of TOP-1000 enterprises for 2017
In general, there is a trend towards an increase in revenue volume (Picture 4).
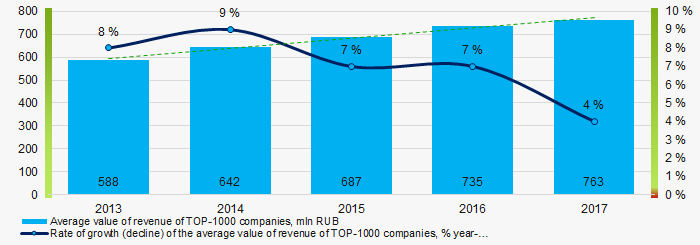 Picture 4. Change in the average revenue of TOP-100 enterprises in 2013 – 2017
Profit and losses
The profit volume of 10 industry leaders of the region made 47% of the total profit of TOP-1000 companies in 2017 (Picture 5).
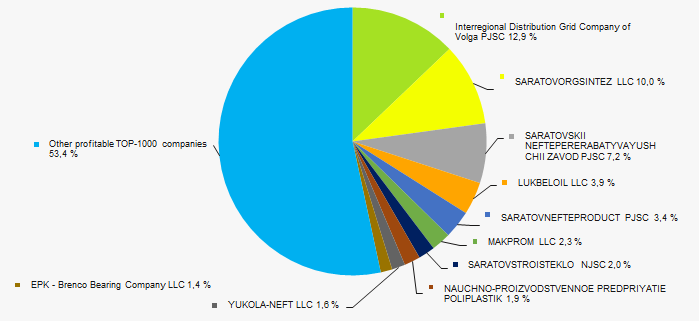 Picture 5. Shares of participation of TOP-10 companies in the total volume of profit of TOP-1000 enterprises for 2017
 In general, the average profit of TOP-1000 enterprises trends to increase over the five-year period (Picture 6).
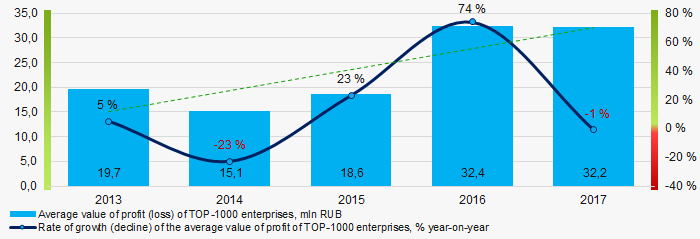 Picture 6. Change in the average values of net profit of TOP-1000 enterprises in 2013 – 2017
 Average values of net profit’s indicators of TOP-1000 companies trend to increase for the five-year period, at the same time the average value of net loss decreases. (Picture 7).
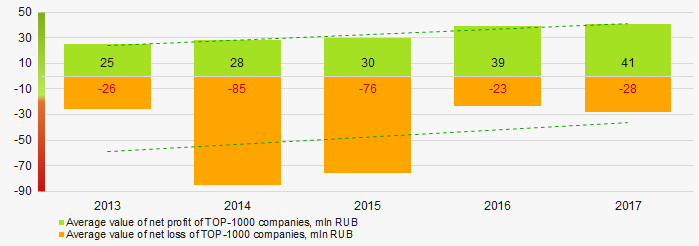 Picture 7. Change in the average values of indicators of net profit and net loss of TOP-1000 companies in 2013 – 2017
Key financial ratios
Over the five-year period the average indicators of the total liquidity ratio of TOP-1000 enterprises were above the range of recommended values - from 1,0 up to 2,0, with a tendency to increase (Picture 8).
The total liquidity ratio (the relation of the amount of current assets to short-term liabilities) shows the sufficiency of company’s funds for repayment of its short-term liabilities.
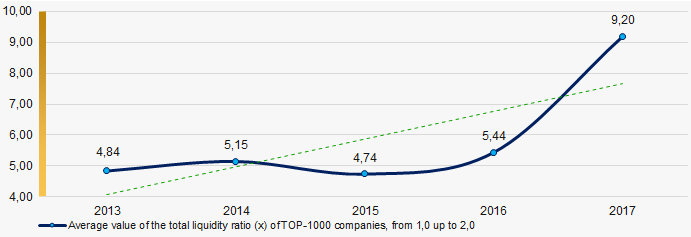 Picture 8. Change in the average values of the total liquidity ratio of TOP-1000 enterprises in 2013 – 2017
 There has been a high level of average values of the return on investment ratio for five years, especially in 2013 - 2014, with a tendency to decrease (Picture 9).
The ratio is calculated as the relation of net profit to the sum of own capital and long-term liabilities and demonstrates the return on the equity of own capital involved in the commercial activity and the long-term borrowed funds of an organization.
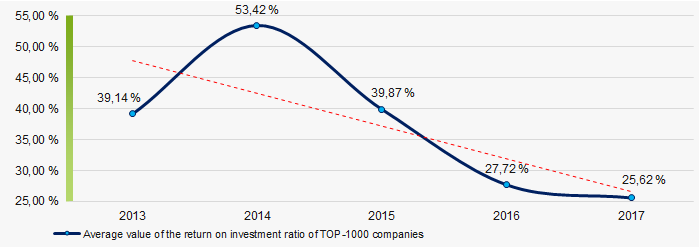 Picture 9. Change in the average values of the return on investment ratio of TOP-1000 enterprises in 2013 – 2017
Asset turnover ratio is calculated as the relation of sales proceeds to the average value of total assets for a period and characterizes the efficiency of use of all available resources, regardless of the sources of their attraction. The ratio shows how many times a year a complete cycle of production and circulation is made, yielding profit.
This ratio of business activity showed a tendency to decrease over the five-year period (Picture 10).
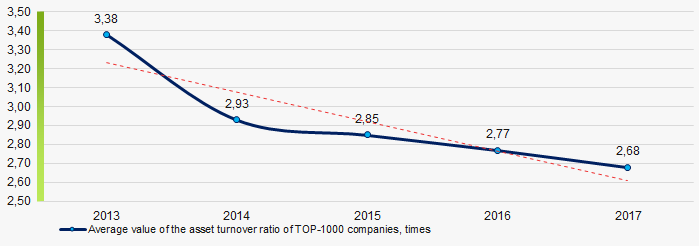 Picture 10. Change in the average values of the asset turnover ratio of TOP-1000 enterprises in 2013 – 2017
Production structure
The largest shares in the total revenue of TOP-1000 are owned by companies, specializing in the manufacture of food products and wholesale (Picture 11).
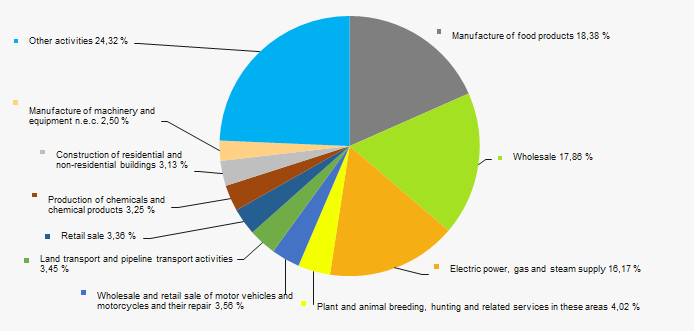 Picture 11. Distribution of types of activity in the total revenue of TOP-1000 companies
78% of TOP-1000 companies are registered in the Register of small and medium-sized businesses of the Federal Tax Service of the RF. At the same time, their share in the total revenue of TOP-1000 enterprises amounted to 25,5% (Picture 12).
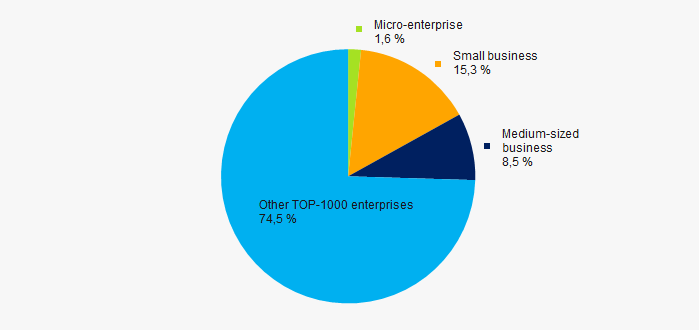 Picture 12. Shares of proceeds of small and medium-sized businesses in TOP-1000 companies
Main regions of activity
The TOP-1000 companies are distributed unequal across Saratov region and registered in 38 districts and inhabited localities. 81% of the largest enterprises in terms of revenue are concentrated in the regional center - in Saratov and in Engels district (Picture 13).
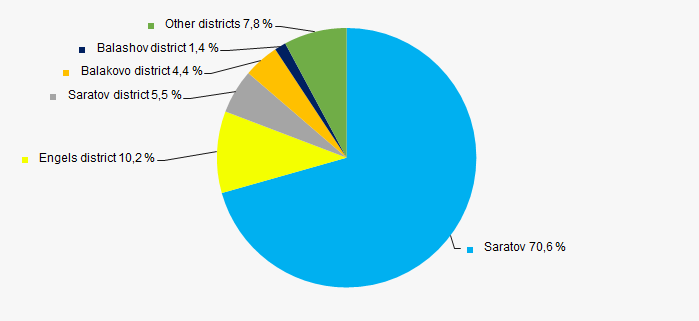 Picture 13. Distribution of the revenue of TOP-1000 companies by regions of Saratov region
Financial position score
An assessment of the financial position of TOP-1000 companies shows that more than half of them are in a stable financial position and above average (Picture 14).
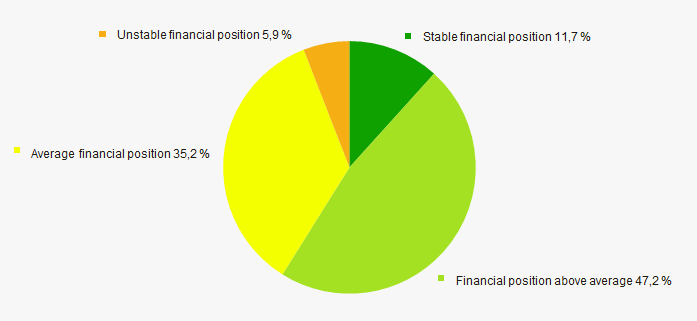 Picture 14. Distribution of TOP-1000 companies by financial position score
Solvency index Globas
Vast majority of TOP-1000 companies got Superior/High or Strong/Medium Solvency index Globas, that points to their ability to pay off their debts in time and fully (Picture 15).
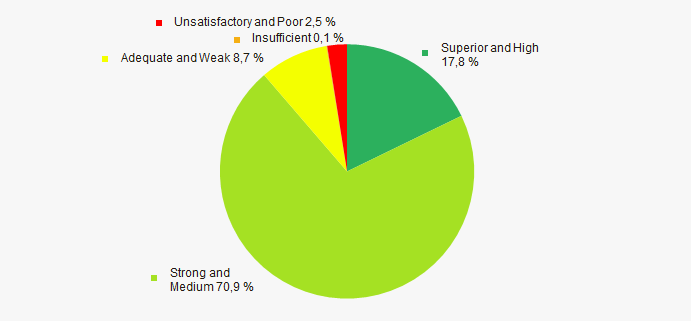 Picture 15. Distribution of TOP-1000 companies by solvency index Globas
Industrial production index
According to the Federal Service of State Statistics, there is a tendency towards an increase in indicators of the industrial production index in Saratov region during 12 months of 2017 - 2018. (Picture 16).
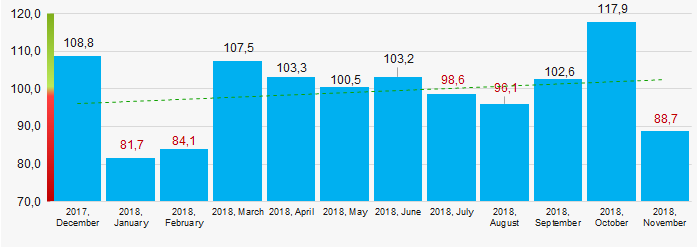 Picture 16. Industrial production index in Saratov region in 2017 – 2018, month to month (%)
According to the same information, the share of enterprises of Saratov region n the amount of revenue from the sale of goods, works, services made 0,48% countrywide for 9 months of 2018.
Conclusion
A comprehensive assessment of activity of the largest companies in the real sector of the economy of Saratov region, taking into account the main indices, financial indicators and ratios, points to the prevalence of positive trends (Table 2).
| Trend and evaluation factors of TOP-1000 enterprise | Specific share of factor, % |
| Rate of growth (decline) in the average size of net assets | |
| Increase / decrease in the share of enterprises with negative values of net assets | |
| Concentration level of capital | |
| Rate of growth (decline) in the average size of revenue | |
| Rate of growth (decline) in the average size of profit (loss) | |
| Growth / decline in average values of companies’ net profit | |
| Growth / decline in average values of companies’ net loss | |
| Increase / decrease in average values of total liquidity ratio | |
| Increase / decrease in average values of return on investment ratio | |
| Increase / decrease in average values of asset turnover ratio, times | |
| Share of small and medium-sized businesses in the region in terms of revenue being more than 30% | |
| Regional concentration | |
| Financial position (the largest share) | |
| Solvency index Globas (the largest share) | |
| Industrial production index | |
| Average value of the specific share of factors | |
![]() — positive trend (factor),
— positive trend (factor), ![]() — negative trend (factor).
— negative trend (factor).