Unified Federal Register of Population Data
The Federal law of June 8, 2020 No. 168-FL provides the formation of the Unified Federal Information Register Containing Data on the Population of the Russian Federation (hereinafter “the Register”).
The law came into force since June 8, 2020. Its certain provisions will be implemented since January 1, 2024 and January 1, 2025. In addition, there is a transition period up to December 31, 2025, and the Register may not be required by the legislative acts as a single and obligatory source of data up to January 1, 2023.
The Register will contain the following data on citizens:
- first, last and middle name;
- date and place of birth;
- gender;
- individual insurance account number (SNILS);
- individual tax number (INN);
- citizenship;
- marital status.
The Federal Tax Service is responsible for the maintenance and data security of the Register. The Register will be based on information containing in the Federal Tax Service, Ministry of Internal Affairs, Ministry of Defense Ministry of Education and Science, and state non-budgetary funds.
Data on taxes and incomes, pension, health condition and other biometric data will not be included.
State administration bodies will have access to the Register as part of their remit. Notary offices will not have direct access. However, they will be obliged to check data upon request when notarizing.
In case of discovering a mistake, the adopted law determines the procedure of introduction of amendment to the Register upon the application of the citizens. Removal of records from the Register is not provided.
The Unified register is expected to promote more accurate forecasts of the country’s development and promptly manage the ongoing processes.
Trends in aerospace industry
Information agency Credinform has prepared a review of trends of the largest Russian companies of the aerospace industry.
The largest trading companies (TOP-100) in terms of annual revenue were selected for the analysis according to the data from the Statistical Register for the latest available periods (2013-2018). The analysis was based on the data of the Information and Analytical system Globas.
Net assets are total assets less total liabilities. This indicator reflects the real value of the property of an enterprise. When the company’s debt exceeds the value of its property, the indicator is considered negative (insufficiency of property).
The largest company in term of net assets is State Space Corporation ROSCOSMOS, INN 7702388027, In 2018, net assets value of the corporation exceeded 244 billion RUB.
The lowest net assets volume among TOP-50 belonged to JSC EXPERIMENTAL MACHINEBUILDING PLANT OF KOROLEV ROCKET SPACE CORPORATION ENERGIA, INN 5018037000, Moscow In 2018, insufficiency of property of the company was indicated in negative value of -2,5 billion RUB.
Covering the five-year period, the average net assets values have a trend to increase (Picture 1).
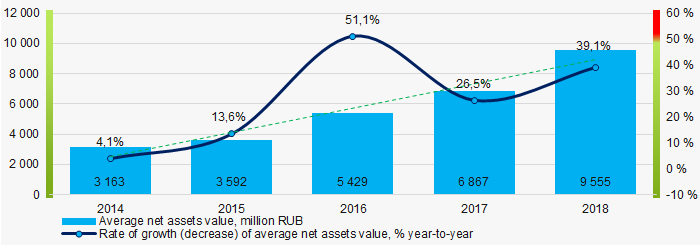 Picture 1. Change in average net assets value in 2014 – 2018
The shares of TOP-50 companies with insufficient property have trend to increase over the past five years (Picture 2).
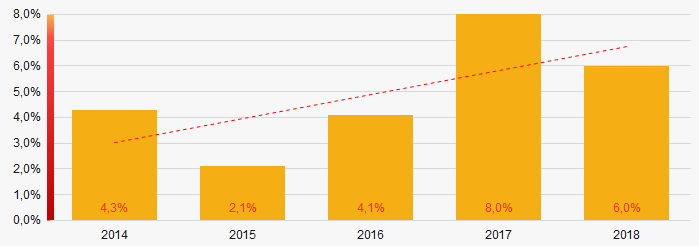 Picture 2. Shares of companies with negative net assets value in TOP-50
Sales revenue
In 2018, the revenue volume of 10 largest companies of the industry was 68% of total TOP-50 revenue (Picture 3). This is indicative of high level of monopolization in the industry.
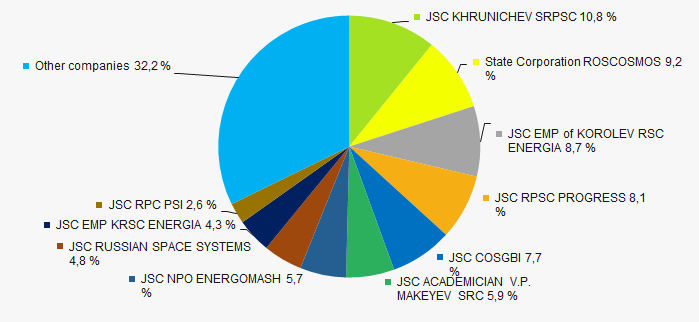 Picture 3. The share of TOP-10 companies in total 2018 revenue of TOP-50
 In general, there is a trend to increase in revenue with a slowdown of the growth rate over the past three years (Picture 4).
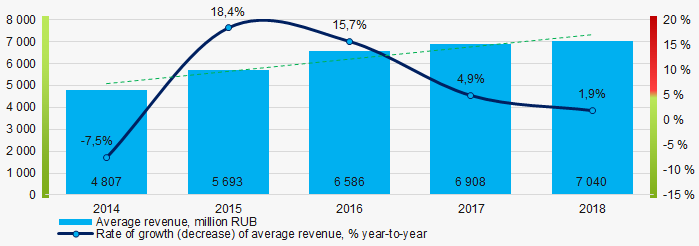 Picture 4. Change in average net profit in 2014 – 2018
Profit and loss
The largest company in term of net profit is State Space Corporation ROSCOSMOS, INN 7702388027, Moscow. The company’s profit for 2018 almost reached 10 billion RUB.
Covering the five-year period, there is a trend to increase in average net profit (Picture 5).
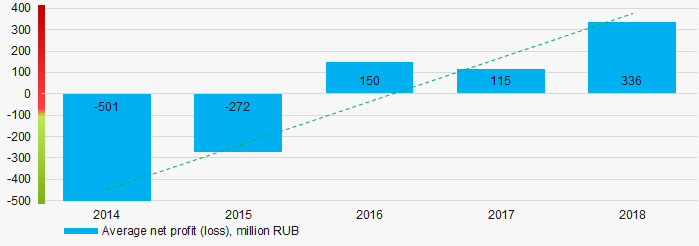 Picture 5. Change in average net profit (loss) values in 2014 – 2018
For the five-year period, the average net profit values of TOP-50 have the increasing trend with the decreasing net loss (Picture 6).
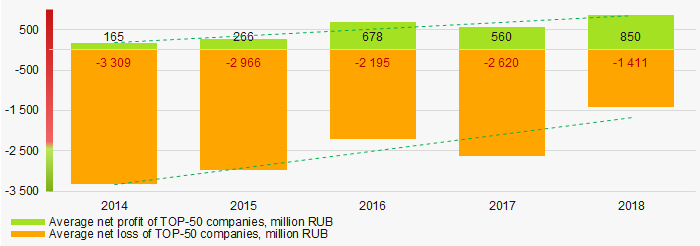 Picture 6. Change in average net profit and net loss of ТОP-100 in 2014 – 2018
Key financial ratios
Covering the five-year period, the average values of the current liquidity ratio were mainly within the recommended one - from 1,0 to 2,0 with a trend to increase (Picture 7).
Current liquidity ratio (current assets to short-term liabilities) shows the sufficiency of company’s assets to repay on short-term liabilities.
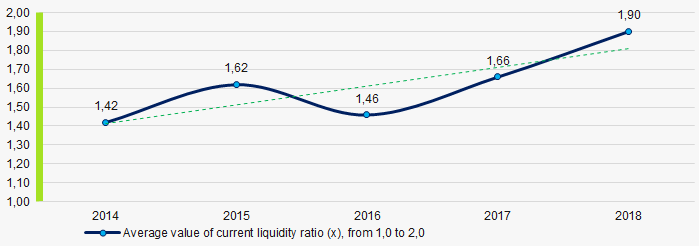 Picture 7. Change in average values of current liquidity ratio in 2014 – 2018
 Covering the five-year period, the average values of ROI ratio have a trend to decrease (Picture 8).
ROI ratio is calculated as net profit to sum of shareholders equity and long-term liabilities, and shows the return of equity involved in commercial activities and long-term borrowed funds.
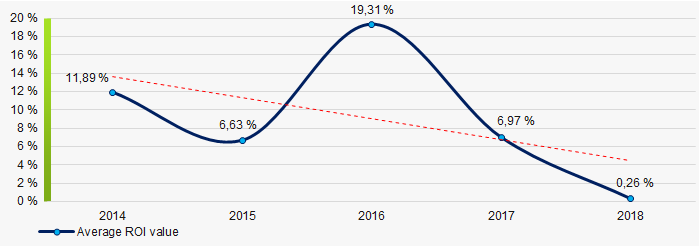 Picture 8. Change in average values of ROI ratio in 2014 – 2018
Assets turnover ratio is the ratio of sales revenue and company’s average total assets for a period. It characterizes the effectiveness of using of all available resources, regardless the source of their attraction. The ratio shows how many times per year the full cycle of production and circulation is performed, generating the corresponding effect in the form of profit.
Covering the five-year period, business activity ratio demonstrated the decreasing trend (Picture 9).
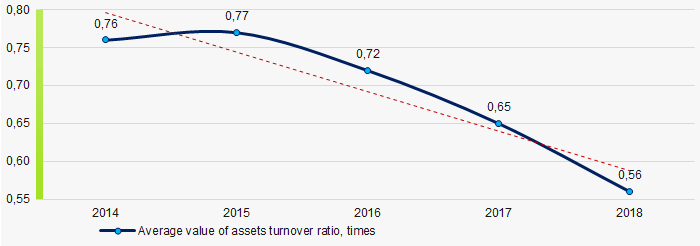 Picture 9. Change in average values of assets turnover ratio in 2014 – 2018
Small business
Only one company from TOP-50 is registered in the Register of small and medium-sized enterprises of the Federal Tax Service of the Russian Federation. Its share in total revenue of TOP-50 companies is 0,02%.
Main regions of activity
Companies of TOP-50 are registered in 14 regions of Russia, and unequally located across the country. Almost 69% of companies largest by revenue are located in Moscow and Moscow region (Picture 10).
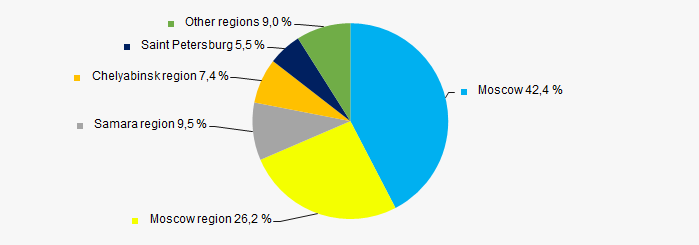 Picture 10. Distribution of TOP-50 revenue by regions of Russia
Financial position score
Assessment of the financial position of TOP-50 companies shows that the majority of them have financial position above average (Picture 11).
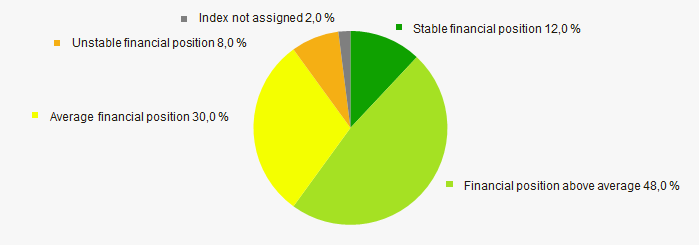 Picture 11. Distribution of TOP-50 companies by financial position score
Solvency index Globas
Most of TOP-50 companies got Superior / High and Strong / Medium index Globas. This fact shows their ability to meet their obligations fully (Picture 12).
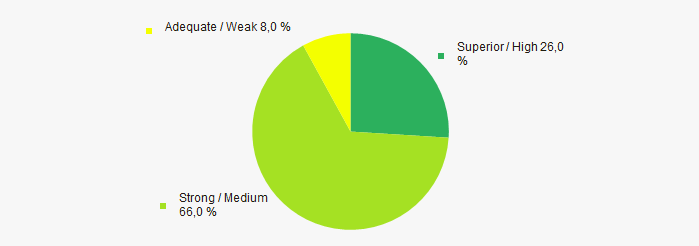 Picture 12. Distribution of TOP-50 companies by solvency index Globas
Conclusion
Complex assessment of activity of the largest Russian companies of the aerospace industry, taking into account the main indexes, financial ratios and indicators, demonstrates the prevalence of positive trends in 2014-2018 (Table 1).
| Trends and evaluation factors | Relative share of factors, % |
| Rate of growth (decline) in the average size of net assets |  10 10 |
| Increase / decrease in the share of enterprises with negative values of net assets |  -10 -10 |
| Level of competition / monopolization |  -10 -10 |
| Rate of growth (decline) in the average size of revenue |  5 5 |
| Rate of growth (decline) in the average size of profit (loss) |  10 10 |
| Growth / decline in average values of companies’ net profit |  10 10 |
| Growth / decline in average values of companies’ net loss |  10 10 |
| Increase / decrease in average values of total liquidity ratio |  10 10 |
| Increase / decrease in average values of return on investment ratio |  -10 -10 |
| Increase / decrease in average values of asset turnover ratio, times |  -10 -10 |
| Share of small and medium-sized businesses in terms of revenue being more than 20% |  -10 -10 |
| Regional concentration |  -10 -10 |
| Financial position (the largest share) |  10 10 |
| Solvency index Globas (the largest share) |  10 10 |
| Average value of relative share of factors |  1,1 1,1 |
 positive trend (factor),
  negative trend (factor).