
Order a report
Custom-made industry research, company ratings, competitor analysis


Trends in publishing activities
Information Agency Credinform presents a review of trends in publishing activities.
The publishing houses with the highest volume of annual revenue (TOP-10 and TOP-1000) have been selected for the ranking, according to the data from the Statistical Register for the latest available accounting periods (2015 and 2016). The analysis was based on the data from the Information and Analytical system Globas.
Net assets
It is an indicator of fair value of corporate assets that is calculated annually as assets on balance less company’s liabilities. Net assets value is negative (insufficiency of property) if liabilities are larger than the property value.
| No. in TOP-1000 | Name, INN, region | Net assets value, million RUB* | Solvency index Globas | ||
| 2014 | 2015 | 2016 | |||
| 1 | 2 | 3 | 4 | 5 | 6 |
| 1. | Prosveshcheniye Publishers NJSC INN 7715995942 Moscow |
4 388,3 | 9 020,7 | 1 133,2 | 249 Strong |
| 2. | AST Publishing House LLC INN 7710899593 Moscow The company is a defendant in arbitration proceedings and has unsatisfied writs of execution. |
416,4 | 746,0 | 4 952,6 | 550 Insufficient |
| 3. | Publishing House E LLC INN 7708188426 Moscow |
3 172,0 | 3 889,3 | 4 225,0 | 161 Superior |
| 4. | ARGUMENTY I FACTY NJSC INN 7701103751 Moscow |
1 864,0 | 2 080,1 | 2 419,4 | 182 Strong |
| 5. | YAUZA Publishing House LLC INN 7707195170 Moscow |
482,9 | 870,8 | 2 027,8 | 166 Superior |
| 996. | Publishing House Interview LLC INN 7702753946 Moscow |
-336,5 | -512,9 | -515,9 | 372 Adequate |
| 997. | Editorial Office of the Kultura Newspaper PJSC INN 7707146913 Moscow |
-164,0 | -386,1 | -519,8 | 301 Adequate |
| 998. | Business News Media NJSC INN 7712108141 Moscow |
-349,6 | -639,0 | -581,0 | 271 Medium |
| 999. | INEWS LLC INN 7743814193 Moscow |
-425,8 | -529,6 | -790,7 | 330 Adequate |
| 1000. | Company Afisha LLC INN 7710861670 Moscow |
-212,1 | -425,6 | -797,6 | 304 Adequate |
*) — growth or decline values compared to prior period are highlighted green and red respectively in columns 4 and 5.
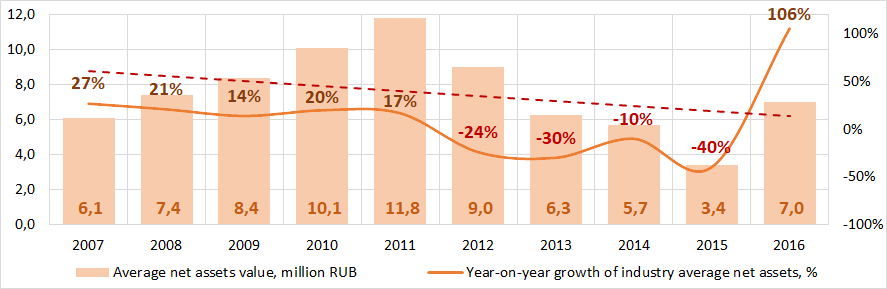 Picture 1. Change in average net asset value of the largest publishing houses in 2007 — 2016
Sales revenue
In 2016 sales revenue of 10 industry leaders amounted to 45% of total revenue of TOP-1000 companies. This is an indicator of a relatively high level of monopolization within the sector (Picture 2).
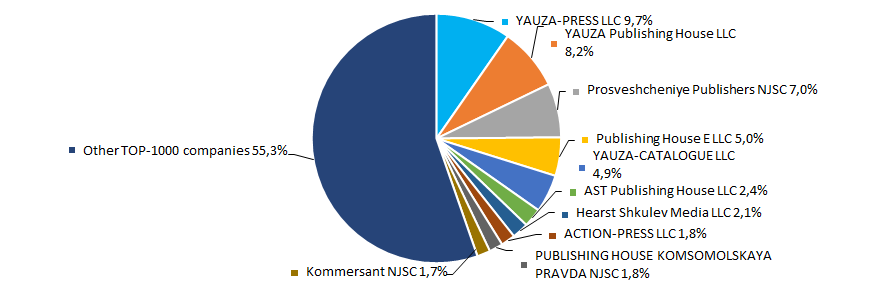 Picture 2. TOP-10 companies by their share in 2016 total revenue of TOP-1000 companies
In general, revenue tends to decline (Picture 3).
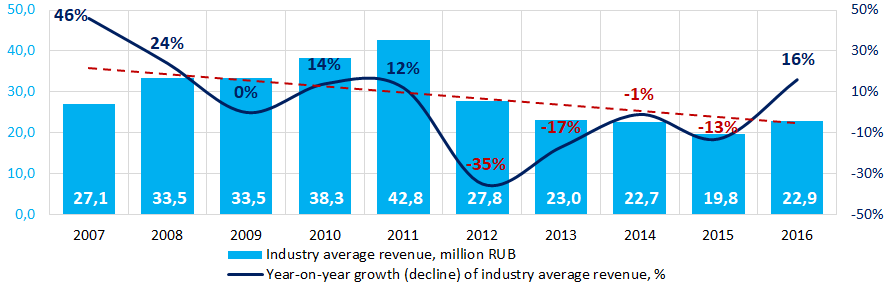 Picture 3. Change in average revenue of publishing houses in 2007— 2016
Profit and loss
In 2016 profit of 10 industry leaders amounted to 66% of total profit of TOP-1000 companies (Picture 4).
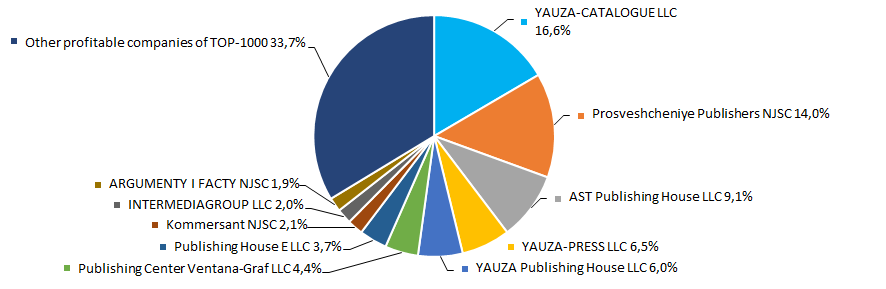 Picture 4. TOP-10 companies by their share in 2016 total profit of TOP-1000 companies
Average profit values of companies of the sector within a decade tend to decline (Picture 5).
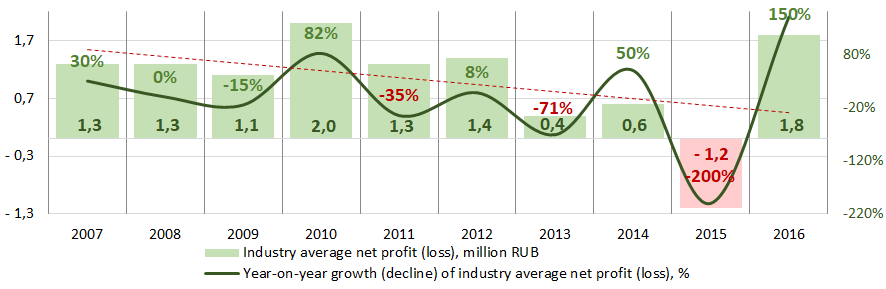 Picture 5. Change in average profit of the largest publishing houses in 2007 — 2016
Average profit values of TOP-1000 companies for three years tend to decline, as well as average loss value (Picture 6).
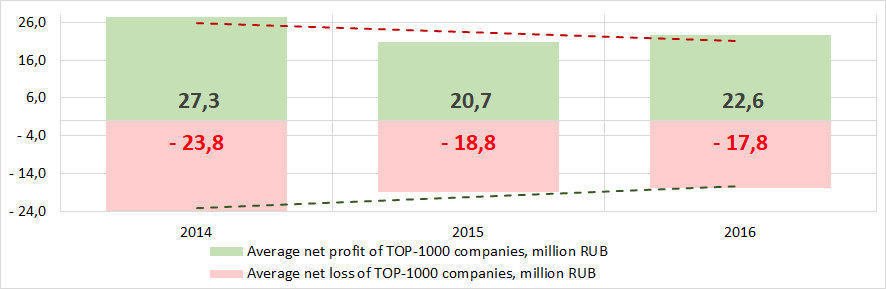 Picture 6. Change in average profit and loss of the largest publishing houses in 2014 — 2016
Key financial ratios
During the last decade industry average values of liquidity coverage ratio were within the recommended value — from 1,0 to 2,0 (Picture 7). In general, the ratio value tends to increase.
Liquidity coverage ratio (a ratio of current assets to current liabilities) reveals the sufficiency of a company’s funds for meeting its short-term liabilities.
A calculation of practical values of financial ratios, which might be considered as normal for a certain industry, has been developed and implemented in the Information and Analytical system Globas by the experts of the Information Agency Credinform, having taken into account the current situation in the economy as a whole and in the industries. The practical value of liquidity coverage ratio of publishing houses amounted from 0,75 to 3,33 in 2016.
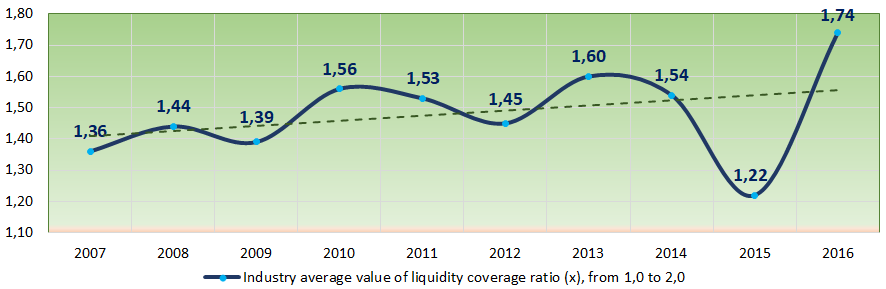 Picture 7. Change in average values of liquidity coverage ratio of publishing houses in 2007 — 2016
The return on investment ratio (Picture 8) was not stable during the decade, tending to decrease. It is a ratio of net profit to shareholders’ equity and noncurrent liabilities, and it demonstrates benefit from shareholders’ equity engaged in business activity and long-term raised funds of the company.
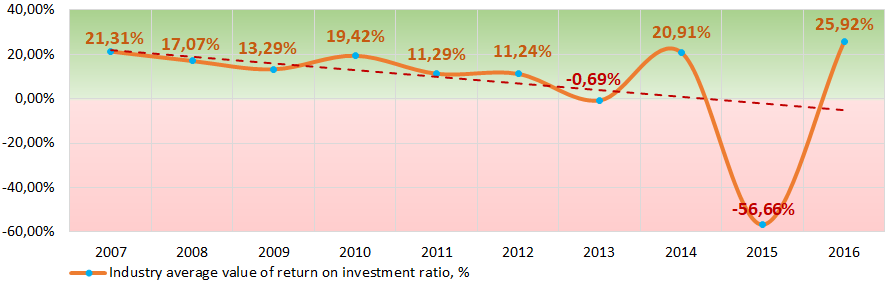 Picture 8. Change in industry average values of return on investment ratio of publishing houses in 2007 — 2016
Assets turnover ratio is a ratio of sales revenue to average total assets for the period, and it measures resource efficiency regardless of the sources. The ratio indicates the number of profit-bearing complete production and distribution cycles per annum.
During the decade, this activity ratio tended to decrease in general (Picture 9).
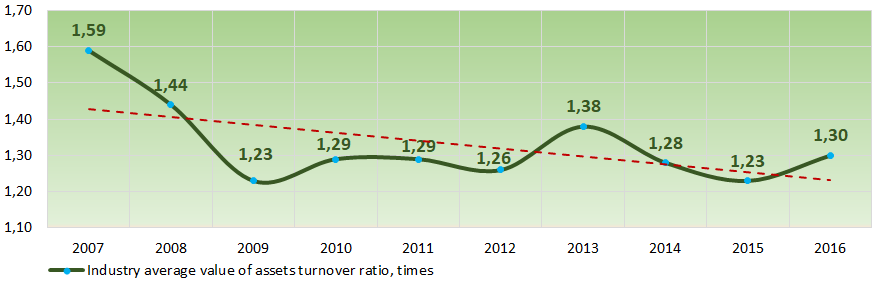 Picture 9. Change in industry average values of assets turnover ratio of publishing houses in 2007 — 2016
Activities structure
Companies that specialize in wide-profile publishing activities have the largest share in total revenue of TOP-1000 companies (Picture 10).
 Picture 10. Types of activity by their share in total revenue of TOP-1000 companies, %
77% companies of TOP-1000 are included in the register of small and medium-sized businesses of the Federal Tax Service of the Russian Federation, among them 35% are micro enterprises, 40% are small businesses, and 2% are considered medium-sized businesses.
Key regions of activity
TOP-1000 companies are unevenly located throughout Russian territory, and are registered in 71 region (Picture 11).
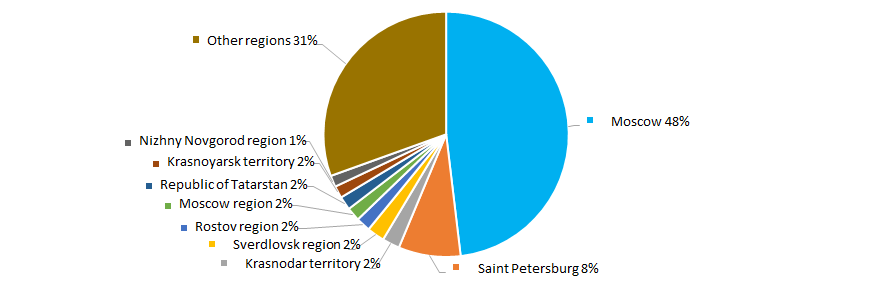 Picture 11. TOP-1000 companies by Russian regions
Financial position score
Assessment of financial state of TOP-1000 companies indicates that most of the companies have an average financial standing (Picture 12).
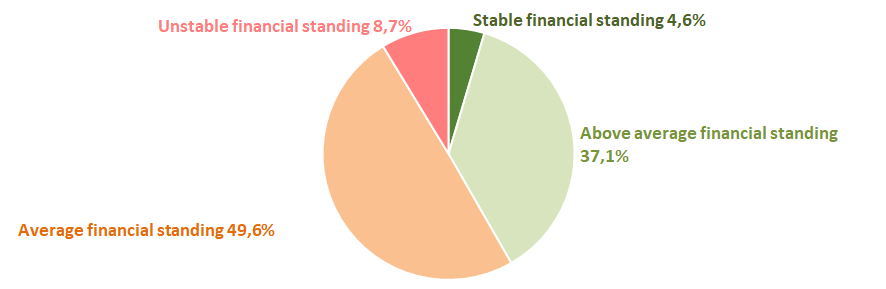 Picture 12.TOP-1000 companies by their financial position score
Solvency index Globas
Most of TOP-1000 companies have got a superior, high, strong and medium Solvency index Globas,that indicates their capability to meet liabilities timely and in full (Picture 13).
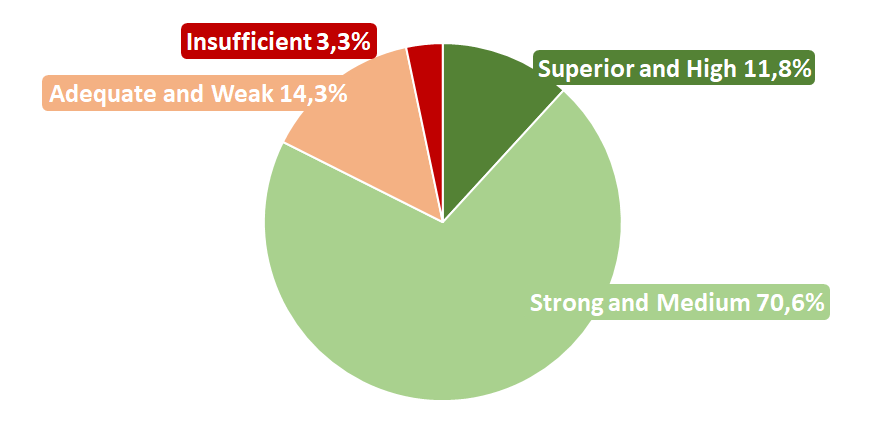 Picture 13. TOP-1000 companies by Solvency index Globas
Therefore, a comprehensive assessment of the largest publishing houses, that considers key indexes, financial figures and ratios, is indicative of negative trends in the sector.