Changes in legislation
From November 1, 2020, the Federal Law of July 31, 2020 No. 247-FL "On mandatory requirements in the Russian Federation" comes into force.
Mandatory requirements are requirements established by:
- federal laws,
- decrees of the President of the Russian Federation,
- legal acts of the Government of the Russian Federation, federal executive bodies and subjects of the Russian Federation, municipal legal acts,
- the Treaty on the Eurasian Economic Union of 29 May, 2014 and the legal acts of the Eurasian Economic Union,
- international treaties of the Russian Federation,
- legal acts of the State Atomic Energy Corporation «Rosatom» and the State Corporation for Space Activities «Roskosmos».
The law defines the principles for establishing and assessing the application of the mandatory requirements contained in regulatory legal acts:
- related to the implementation of business and economic activities,
- compliance with which is monitored by state and municipal supervisory authorities,
- related to bringing to administrative responsibility, with the provision of licenses and other permits, accreditations, etc.
The law stipulates that legal acts establishing mandatory requirements may enter into force only from March 1 or September 1 of the corresponding year, but not earlier than 90 days after the day of official publication.
The law also defines the principles for establishing and assessing the application of mandatory requirements:
- the purposes of establishing mandatory requirements can only be the protection of people's life and health, morality, rights and legitimate interests of citizens and organizations, not causing harm to animals, plants, environment, defense and security of the state, cultural heritage objects, values protected by law;
- application of mandatory requirements by analogy is unacceptable;
- mandatory requirements must correspond to the modern level of development of science and technology, national economy and material and technical base;
- assessment of the risk of causing harm to legally protected values should be the result of an analysis of objective and regularly collected information on the level of harm caused;
- establishment of mandatory requirements should be accompanied by an assessment of the availability and effectiveness of alternative measures to prevent harm;
- mandatory requirements must comply with the principle of legal certainty, ie. be clear, logical and understandable;
- mandatory requirements should not duplicate and contradict each other;
- mandatory requirements must be brought to the attention of persons obliged to comply with them by publishing regulatory legal acts in compliance with the relevant procedures;
- mandatory requirements must be enforceable, ie. commensurate with the cost of their implementation and with the risks avoided by these requirements;
- establishment of mandatory requirements that exclude the possibility of fulfilling other mandatory requirements is not permissible;
- risks of selective application of mandatory requirements should be minimized.
The assessment of mandatory requirements for compliance with the legislation of the Russian Federation and the above principles is carried out through legal expertise of draft regulations, including the assessment of regulatory impact.
Regardless of the recognition as invalid, not effective in the territory of the Russian Federation or canceled regulatory legal acts within the framework of the "regulatory guillotine", from January 1, 2021, when exercising state control, it is not allowed to assess compliance with mandatory requirements if they entered into force before January 1, 2020 It was also established that from January 1, 2021, non-compliance with the requirements contained in such acts will not be the basis for bringing to administrative responsibility if they entered into force before January 1, 2020.
From January 1, 2021, when exercising state control, granting licenses and other permits, accreditations, it is not allowed to assess compliance with the mandatory requirements contained in officially unpublished regulatory legal acts (with the exception of requirements constituting state secrets, related to legally protected or restricted information).
These provisions are not applied in the electric power industry, as well as in the implementation of public-private partnership projects with the participation of the Russian Federation.
Activity trends of lottery companies
Information agency Credinform represents a review of the activity trends of the largest lottery companies in Russia.
The largest lottery companies and lottery distributors (TOP-50) in terms of annual revenue were selected for the analysis according to the data from the Statistical Register and the Federal Tax Service for the latest available financial accounts (2010 - 2019). The analysis was based on the data from the Information and Analytical system Globas.
Net assets is an indicator that reflects the real value of the property of an enterprise. It is calculated as a net worth between total assets and total liabilities. When the company’s debt exceeds the value of its property, the indicator is considered negative (insufficiency of property).
The largest company of the industry by the net assets value is NAO TECHNOLOGICAL COMPANY CENTER, INN 7715918994, Moscow. In 2019 company’s net assets amounted to 1,7 billion RUB.
LLC RUSSKOE LOTO POBEDA, INN 7719527590, Moscow, had the lowest net assets value among TOP-50 companies. Insufficiency of property of this company in 2019 was indicated by the negative value – 1,0 billion RUB.
For the decade, the average industry net assets values had a trend to increase, with the positive dynamics of the growth rates (Picture 1).
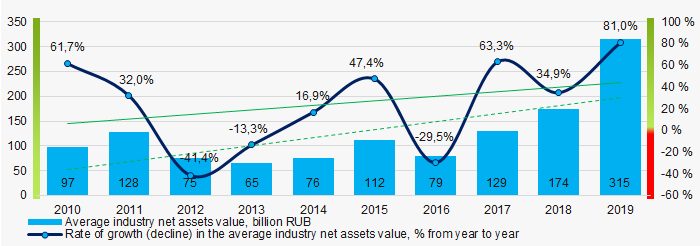 Picture 1. Changes in average industry net assets value in 2010 - 2019
The shares of TOP-50 companies with insufficient property were decreasing in the last five years (Picture 2).
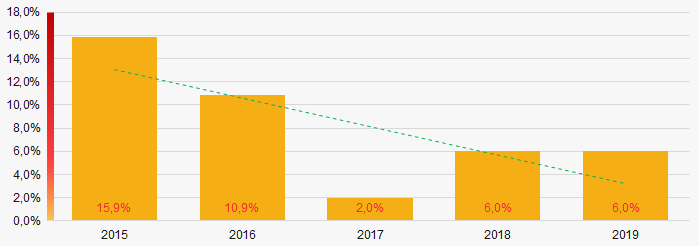 Picture 2. Shares of companies with negative net assets value in TOP-50 in 2015 - 2019
Sales revenue
Revenue of only two leading industry companies amounted to 95% of the total revenue of TOP-50 companies. (Picture 3). It gives evidence to the highest level of monopolization in this industry.
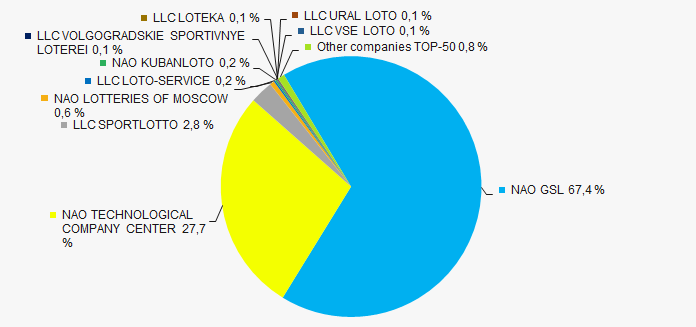 Picture 3. Shares of TOP-10 companies in the total revenue of 2019 TOP-1000
 In general, there is a trend to increase in revenue with the positive dynamics of the growth rates (Picture 4.)
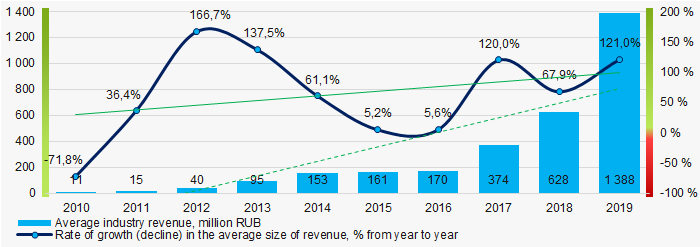 Picture 4. Changes in average industry revenue in 2010 - 2019
Profit and losses
The largest industry company by the net profit value is also NAO TECHNOLOGICAL COMPANY CENTER, INN 7715918994, Moscow. The company’s profit in 2019 amounted to 1,7 billion RUB.
For the decade, the average industry profit values have a trend to increase (Picture 5).
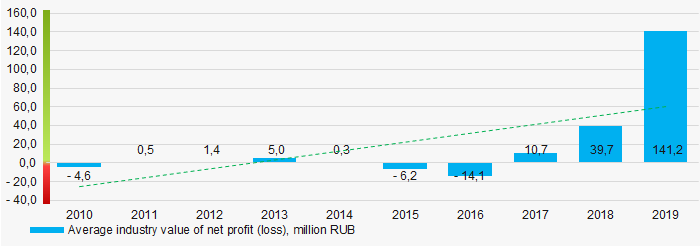 Picture 5. Changes in average industry profit (loss) in 2010 -2019
For the five-year period, the average net profit values of TOP-50 companies have a trend to increase, the average net loss value increases as well. (Picture 6).
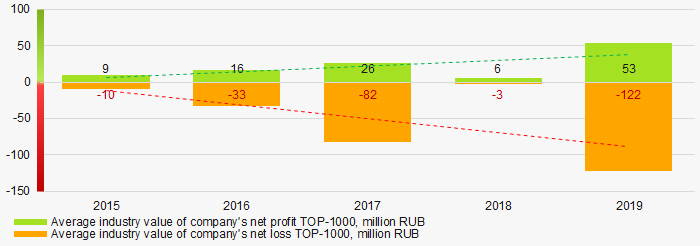 Picture 6. Change in average net profit and net loss of TOP-50 companies in 2015 - 2019
Key financial ratios
For the decade, the average industry values of current liquidity ratio were in general within the interval of the recommended values – from 1,0 to 2,0, with a trend to decrease. (Picture 7).
Current liquidity ratio (current assets to short-term liabilities) shows the sufficiency of company’s assets to repay on its short-term liabilities.
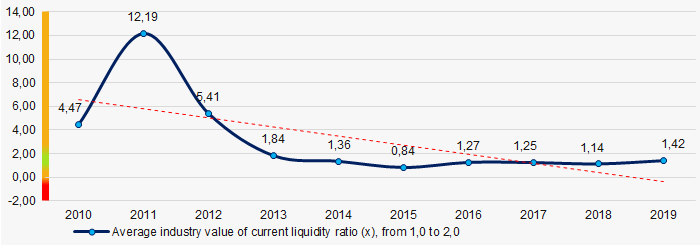 Picture 7. Change in average industry values of current liquidity ratio in 2010 - 2019
For the decade, there is a trend to increase in the average industry values of return on investments ratio. (Picture 8).
ROI ratio is calculated as net profit to sum of shareholders equity and long-term liabilities, and shows the return of equity involved in commercial activities and long-term borrowed funds.
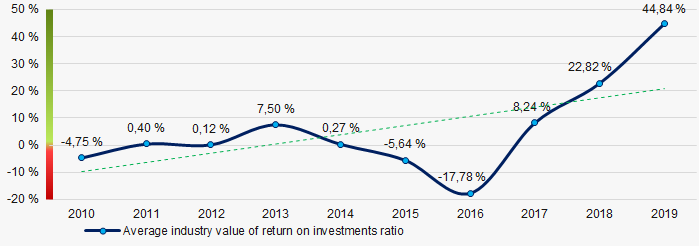 Picture 8. Change in average industry values of return on investments ratio in 2010 - 2019
Assets turnover ratio is calculated as a ratio of sales revenue to average total assets for a period and defines the efficiency of use of all the available resources, regardless source of their attraction. The ratio shows how many times per year the full cycle of production and circulation generating profit is performed.
For the decade, there was a trend to increase (Picture 9).
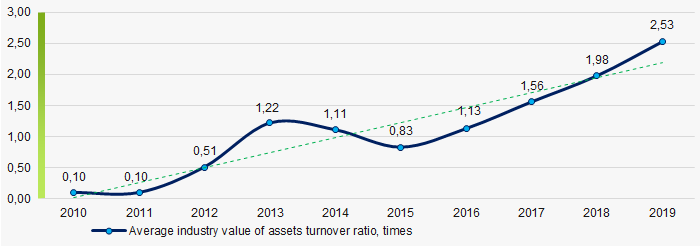 Picture 9. Change in average industry values of assets turnover ratio in 2010 - 2019
Small enterprises
90% of the TOP-50 companies are registered in the Register of small and medium-sized enterprises of the Federal Tax Service of the Russian Federation. However, their share in the total revenue of TOP-50 amounts to only 4%, which is significantly lower than the average country value in 2018 – 2019 (Picture 10).
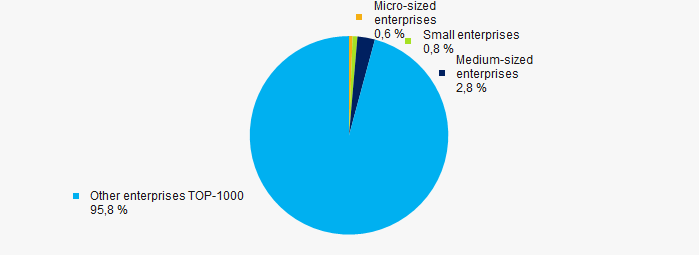 Picture 10. Shares of small and medium business enterprises revenue in TOP-1000
Main regions of activity
TOP-50 companies are registered in 33 regions and spread in an uneven manner within the country. Almost 99% of the largest by the revenue companies consolidate in Moscow (Picture 11).
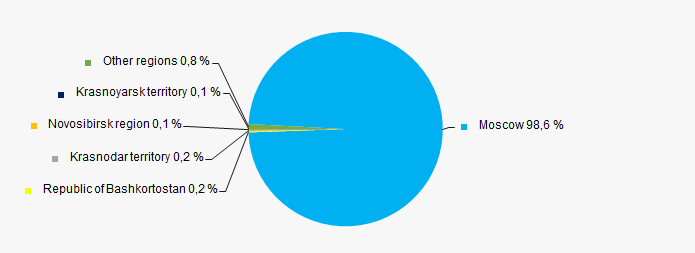 Picture 11. Revenue distribution of TOP-50 companies by regions in Russia
Financial position score
According to the assessment, the financial position of most TOP-50 companies is above average (Picture 12).
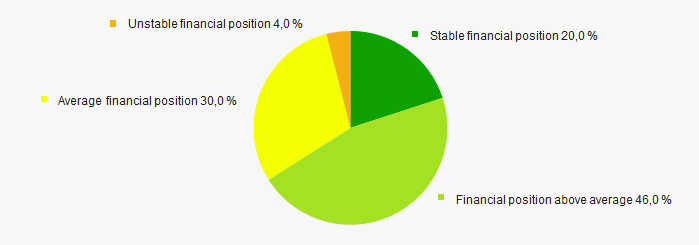 Picture 12. Distribution of TOP-50 companies by financial position score
Solvency index Globas
The major part of TOP-50 companies was awarded with the Superior/High or Strong/Medium Solvency index Globas, which gives evidence to their ability to meet their obligations fully and in time (Picture 13).
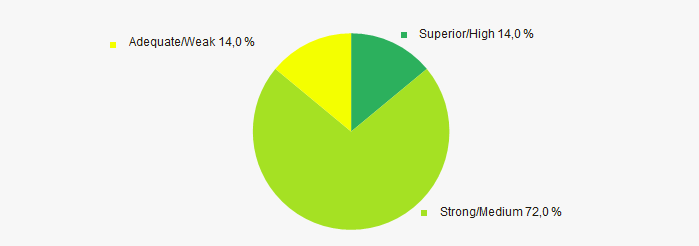 Picture 13. Distribution of TOP-50 companies by Solvency index Globas
Conclusion
The complex assessment of the activity of the largest lottery companies in Russia, taking into account the main indexes, financial indicators and ratios, demonstrates the prevalence of positive trends in 2010 - 2019 (Table 1).
| Trends and evaluation factors | Relative share of factor, % |
| Dynamics of the average net assets value |  10 10 |
| Rate of growth (decline) in the average size of net assets |  10 10 |
| Increase / decrease in the share of enterprises with negative values of net assets |  10 10 |
| Level of competition / monopolization |  -10 -10 |
| Dynamics of the average revenue |  10 10 |
| Rate of growth (decline) in the average size of revenue |  10 10 |
| Dynamics of the average profit (loss) |  10 10 |
| Growth / decline in average values of companies’ net profit |  10 10 |
| Growth / decline in average values of companies’ net loss |  -10 -10 |
| Increase / decrease in average values of current liquidity ratio |  -5 -5 |
| Increase / decrease in average values of return on investment ratio |  10 10 |
| Increase / decrease in average values of asset turnover ratio, times |  10 10 |
| Share of small and medium-sized businesses in terms of revenue being more than 20% |  -10 -10 |
| Regional concentration |  -10 -10 |
| Financial position (the largest share) |  10 10 |
| Solvency index Globas (the largest share) |  10 10 |
| Average value of relative share of factors |  4,1 4,1 |
 positive trend (factor),
  negative trend (factor).