
Order a report
Custom-made industry research, company ratings, competitor analysis


New year’s recipe by Credinform
It's time to prepare for the New Year 2021. Due to the closed borders, the upcoming holiday will be truly homely: the nearest and dearest people will gather at the New Year's table with traditional champagne, tangerines and Olivier salad.
On the eve of the holiday, Credinform experts analyzed the largest retail chains where Russians will buy groceries for the New Year's table.
The largest retail grocery chains in Russia
A highly competitive food market has developed in Russia in a relatively short period. It is represented by both “near the house” small chain stores and large hypermarkets.
Retail trade has become one of the most important segments of the domestic economy, which quickly introduced modern technologies in both logistics and customer service: cashless payment, online ordering, various services, loyalty programs, etc. Leading chains are located not only in large cities, but also in small regional centers and countryside.
There are 10 retail chains in Russia with annual turnover exceeding 100 billion RUB. The largest ones in terms of the number of stores are: Magnit - 21,154 stores, Pyaterochka - 16,385, Diksi - 2,655, Monetka - 1,634, Perekrestok - 910, Lenta - 379, Auchan - 255, Miratorg - 93, Metro - 92, O'Key - 77. VkusVill healthy food chain with 1,473 stores and turnover of 83 billion RUB, is approaching the TOP-10 leaders.
At the same time, Pyaterochka, Perekrestok, and Karusel are part of the X5 Retail Group Holding. The turnover of the group in 2019 reached 1,7 trillion RUB. The share of X5 in the retail market is 10.5%. The chain of retail stores "Magnit" belongs to the JSC Tander, the main competitor of X5 Retail Group. In 2019, the company received 1,4 trillion RUB of revenue. The market share is about 9%.
Diksi, Krasnoe & Beloe and Bristol are part of the DKBR Mega Retail Group holding having the 4% share in the retail segment. Its revenue in 2019 reached 800 billion RUB.
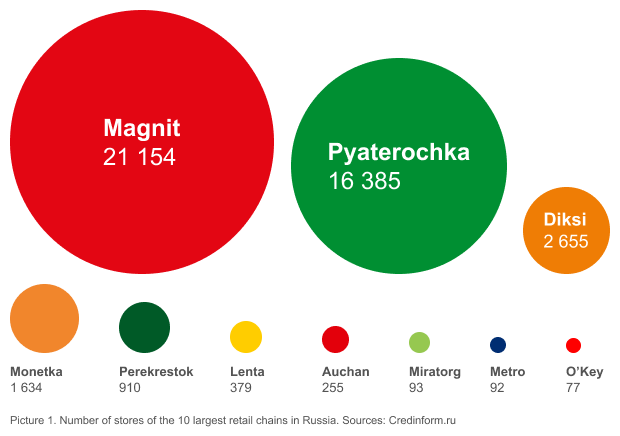 Picture 1. Number of stores of the 10 largest retail chains in Russia. Sources: Credinform.ru
The cost of a grocery list for Olivier salad by Credinform
Lucien Olivier, who created Olivier salad in the 60s of the 19th century, could hardly have imagined that this dish would be a “must” on the New Year's table in Russia. Since the French chef never revealed the original Olivier recipe, there are about a hundred popular variations of this dish.
Experts of the Information agency Credinform in Saint Petersburg have determined the cost of a grocery list for the "classic" Olivier recipe in various chains of the city, choosing the groceries of the highest quality.
| Weight, kg | O’Key | Pyaterochka | Auchan | Lenta | Magnit | Diksi | |
 |
 |
 |
 |
 |
 |
||
| Boiled sausage | 0,3 | 116,85 | 113,97 | 65,94 | 59,97 | 69,00 | 59,4 |
| Pickled cucumbers | 0,4 | 55,72 | 49,99 | 62,72 | 49,99 | 35,00 | 54,92 |
| Canned peas | 0,4 | 129,9 | 99,99 | 95,49 | 120,89 | 105,00 | 87,54 |
| Chicken eggs | 0,2 (4шт.) | 61,5 | 61,99 | 69,99 | 58,99 | 49,00 | 54,58 |
| Mayonnaise | 0,2 | 47,4 | 56,49 | 46,99 | 49,99 | 50,00 | 36,04 |
| Potato | 0,5 | 15,7 | 34,99 | 19,99 | 19,99 | 7,00 | 10,29 |
| Bulb onion | 0,1 | 1 | 1 | 1 | 1 | 1,00 | 1 |
| Carrot | 0,2 | 1 | 1,4 | 1 | 1 | 1,00 | 1 |
| Olivier | 2,1 | 429,07 | 419,82 | 363,12 | 361,82 | 317,00 | 304,77 |
Thus, the classic Olivier recipe by Credinform will cost on average 365 RUB and 93 kopecks.
Of course, everyone has own recipes for both favorite dishes and business success. May you have all the ingredients for well-being and prosperity in the coming year!
Information agency Credinform wishes you a Happy New Year 2021!
May this year bring you only good events and news, be filled with new plans, creative ideas and financial success!