
Order a report
Custom-made industry research, company ratings, competitor analysis


Trends in the work of Stavropol companies
Information agency Credinform represents an overview of activity trends of the largest companies in the real sector of the economy of the Stavropol territory.
The enterprises with the largest volume of annual revenue of the real sector of the economy in the Stavropol territory (TOP-10 and TOP-1000), were selected for the analysis, according to the data from the Statistical Register for the latest available periods (2013-2017). The analysis was made on the basis of the data of the Information and Analytical system Globas.
Net assets is an indicator, reflecting the real value of the property of an enterprise. It is calculated annually as the difference between assets on the balance sheet of the enterprise and its debt obligations. The indicator of net assets is considered negative (insufficiency of property), if company’s debt exceeds the value of its property.
| № | Name, INN, type of activity | Net assets value, bln RUB | Solvency index Globas | ||||
| 2013 | 2014 | 2015 | 2016 | 2017 | |||
| 1 | 2 | 3 | 4 | 5 | 6 | 7 | 8 |
| 1 | VTORAYA GENERIRUYUSHCHAYA KOMPANIYA OPTOVOGO RYNKA ELEKTROENERGII PJSC INN 2607018122 Electric power generation by thermal power plants, including activities on operability assurance of power plants |
|
|
|
|
|
174 Superior |
| 2 | STAVROLEN LLC INN 2624022320 Production of plastics and synthetic resins in primary forms |
|
|
|
|
|
187 High |
| 3 | Interregional Distribution Grid Company of Northern Caucasus PJSC INN 2632082033 Power transmission and technological connection to distribution systems |
|
|
|
|
|
263 Medium |
| 4 | GAZPROM TRANSGAZ STAVROPOL LLC INN 2636032629 Gas pipeline transportation |
|
|
|
|
|
208 Strong |
| 5 | NEVINNOMYSSKY AZOT NJSC INN 2631015563 Production of fertilizers and nitrogen compounds |
|
|
|
|
|
207 Strong |
| 996 | NAUCHNO-PROIZVODSTVENNYI KONTSERN ESKOM PJSC INN 2634040279 Manufacture of pharmaceuticals bankruptcy claim was filed against the company; it is necessary to abide the results of case hearing |
|
|
|
|
|
282 Medium |
| 997 | MASLO STAVROPOLYA NJSC INN 2625023037 Production of crude vegetable oils and their fractions |
|
|
|
|
|
309 Adequate |
| 998 | PLYUS LLC INN 2605012510 Grain growing bankruptcy claim was filed against the company; it is necessary to abide the results of case hearing |
|
|
|
|
|
290 Medium |
| 999 | NK ROSNEFT-STAVROPOLYE NJSC INN 2636035027 Retail sale of automobile fuel in specialized stores |
|
|
|
|
|
277 Medium |
| 1000 | GAZPROM MEZHREGIONGAZ STAVROPOL LLC INN 2635048440 Wholesale of solid, liquid and gaseous fuels and related products |
|
|
|
|
|
293 Medium |
![]() — growth of the indicator to the previous period,
— growth of the indicator to the previous period, ![]() — decline of the indicator to the previous period.
— decline of the indicator to the previous period.
The average values of net assets of TOP-1000 enterprises tend to increase over the ten-year period (Picture 1).
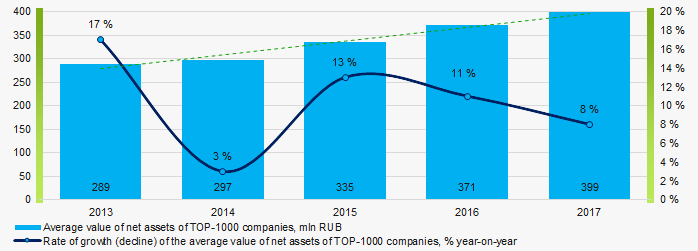 Picture 1. Change in the average indicators of the net asset value of TOP-1000 enterprises in 2013 – 2017
 The shares of TOP-1000 enterprises with insufficiency of assets have a tendency to increase in the last five years (Picture 2).
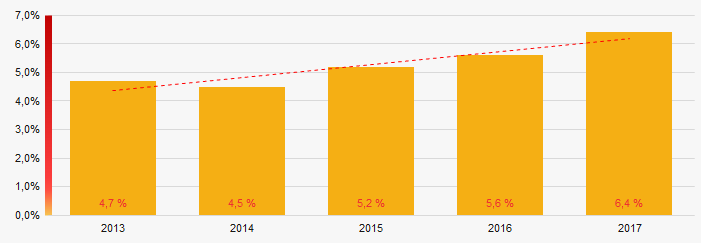 Picture 2. Share of enterprises with negative values of net assets in TOP-1000
Sales revenue
The revenue volume of 10 leading companies of the region made 43% of the total revenue of TOP-1000 enterprises in 2017 (Picture 3). It points to a high level of capital concentration in the Stavropol territory.
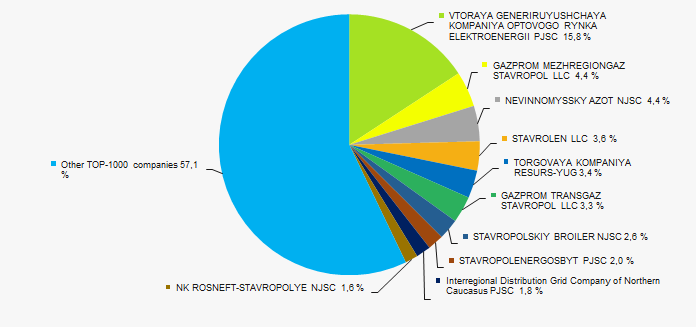 Picture 3. Shares of participation of TOP-10 companies in the total revenue of TOP-1000 enterprises for 2017
In general, there is a trend towards an increase in revenue volume (Picture 4).
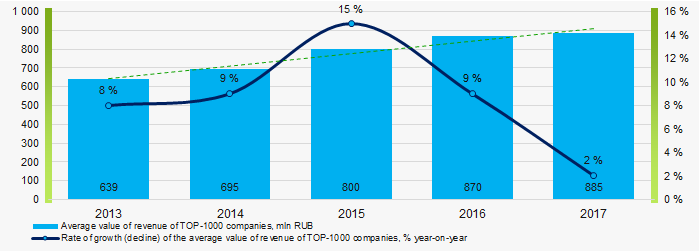 Picture 4. Change in the average revenue of TOP-100 enterprises in 2013 – 2017
Profit and losses
The profit volume of 10 industry leaders of the region made 52% of the total profit of TOP-1000 companies in 2017 (Picture 5).
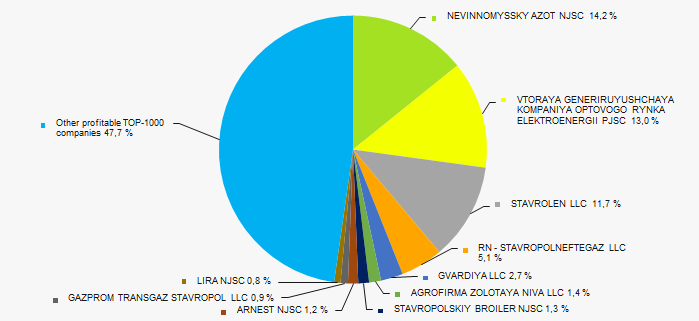 Picture 5. ДShares of participation of TOP-10 companies in the total volume of profit of TOP-1000 enterprises for 2017
In general, average values of net profit’s indicators trend to increase over the ten-year period (Picture 6).
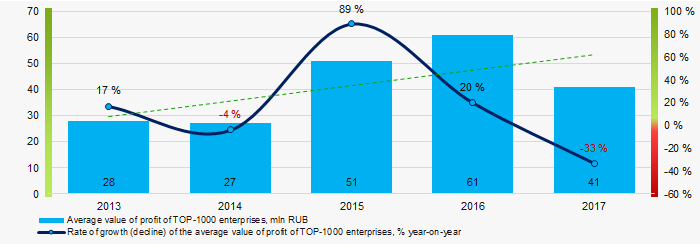 Picture 6. Change in the average values of net profit of TOP-1000 enterprises in 2008 – 2017
 Average values of net profit’s indicators of TOP-1000 companies trend to increase for the five-year period, at the same time the average value of net loss also increases (Picture 7).
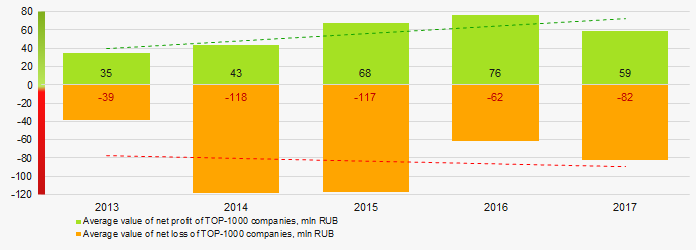 Picture 7. Change in the average values of indicators of net profit and net loss of TOP-1000 companies in 2013 – 2017
 Key financial ratios
Over the five-year period the average indicators of the total liquidity ratio of TOP-1000 enterprises were significantly higher than the range of recommended values - from 1,0 up to 2,0, with a tendency to increase (Picture 8).
The total liquidity ratio (the relation of the amount of current assets to short-term liabilities) shows the sufficiency of company’s funds for repayment of its short-term liabilities.
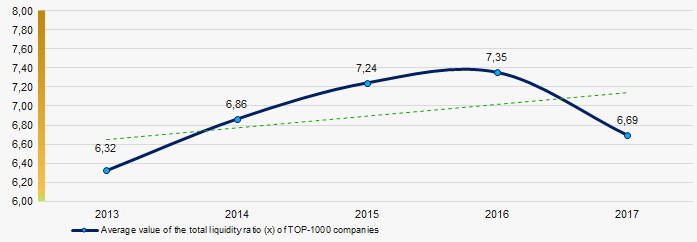 Picture 8. Change in the average values of the total liquidity ratio of TOP-1000 enterprises in 2013 – 2017
 There has been a rather high level of average values of the return on investment ratio for five years, with a tendency to increase. (Picture 9).
The ratio is calculated as the relation of net profit to the sum of own capital and long-term liabilities and demonstrates the return on the equity involved in the commercial activity of own capital and the long-term borrowed funds of an organization.
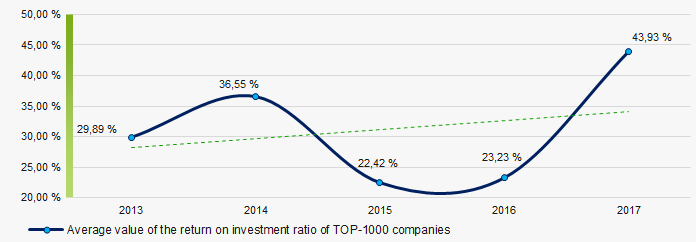 Picture 9. Change in the average values of the return on investment ratio of TOP-1000 enterprises in 2013 – 2017
Asset turnover ratio is calculated as the relation of sales proceeds to the average value of total assets for a period and characterizes the efficiency of use of all available resources, regardless of the sources of their attraction. The ratio shows how many times a year a complete cycle of production and circulation is made, yielding profit.
This ratio of business activity showed a tendency to decrease over the five-year period (Picture 10).
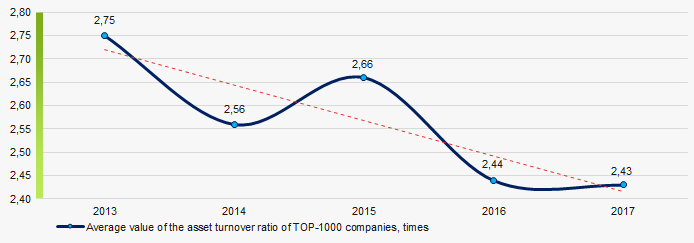 Picture 10. . Change in the average values of the asset turnover ratio of TOP-1000 enterprises in 2013 – 2017
Production structure
The largest share in the total revenue of TOP-1000 is owned by companies, specializing in wholesale, as well as energy providers (Picture 11).
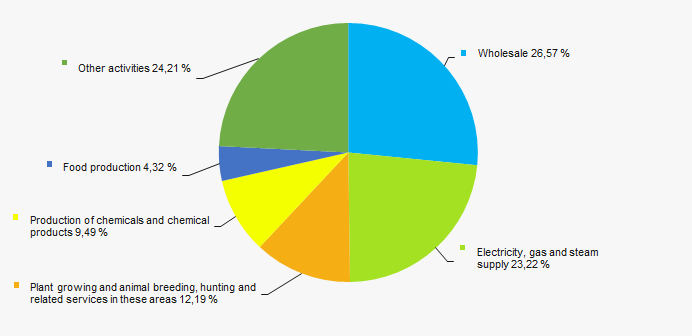 Picture 11. Distribution of types of activity in the total revenue of TOP-1000 companies, %
80% of TOP-1000 companies are registered in the Register of small and medium-sized businesses of the Federal Tax Service of the RF. At the same time, their share in the total revenue of TOP-1000 enterprises amounted to 24% (Picture 12).
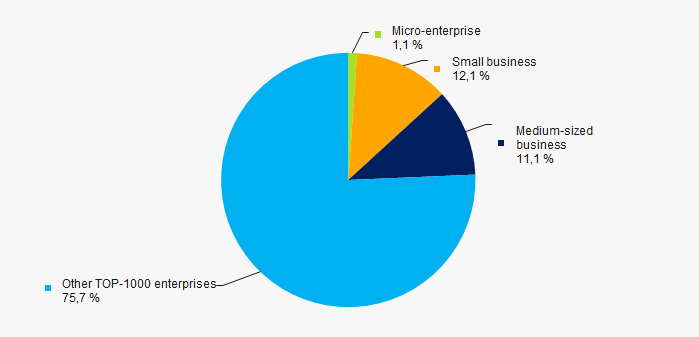 Picture 12. Shares of proceeds of small and medium-sized businesses in TOP-1000 companies
Main regions of activity
The TOP-1000 companies are distributed unequal in the Stavropol territory and registered in 33 regions. The largest enterprises in terms of revenue volume are concentrated in in the regional center – in Stavropol (Picture 13).
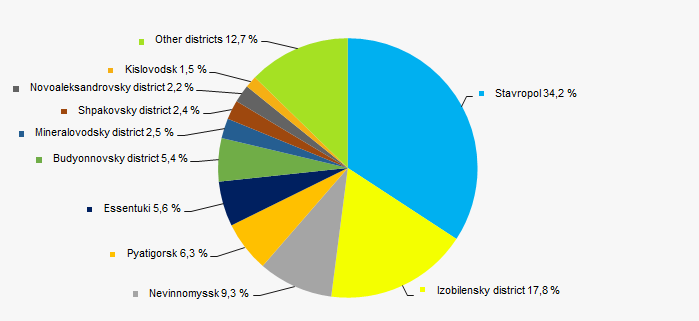 Picture 13. Distribution of the revenue of TOP-1000 companies by regions of Stavropol territory
 Financial position score
An assessment of the financial position of TOP-1000 companies shows that most of them are in above average financial position (Picture 14).
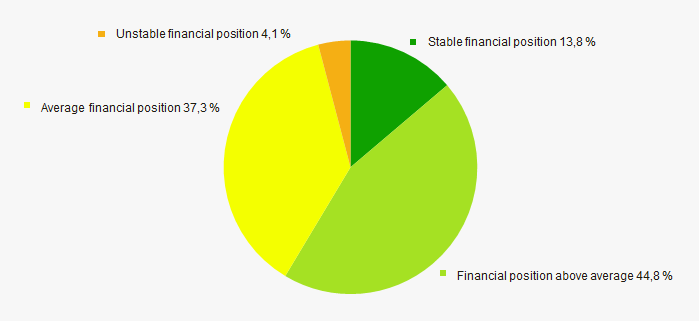 Picture 14. Distribution of TOP-1000 companies by financial position score
 Solvency index Globas
Most of TOP-1000 companies got Superior/High or Medium/Strong Solvency index Globas, that points to their ability to pay off their debts in time and fully (Picture 15).
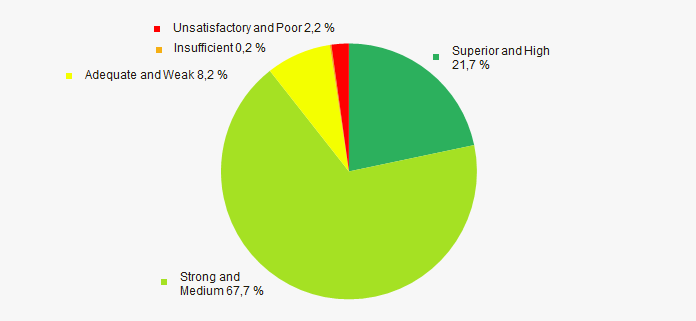 Picture 15. Distribution of TOP-1000 companies by solvency index Globas
 Industrial production index
According to the Federal Service of State Statistics, there is a tendency to decrease in the industrial production index in the Stavropol territory during 12 months of 2017 - 2018. For 9 months of 2018, the industrial production index decreased by an average of 2,5%, and in general, from October 2017 to September 2018, the decline averaged 0,6%(Picture 16).
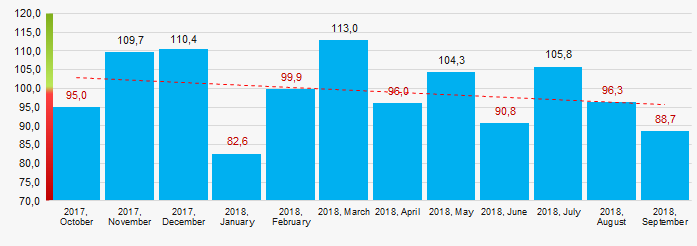 Picture 16. Industrial production index in Stavropol territory in 2017 - 2018, month to month (%)
According to the same information, the share of enterprises of the Stavropol territory in the amount of revenue from the sale of goods, works, services made 0,58% countrywide for 9 months of 2018.
Conclusion
A comprehensive assessment of activity of the largest companies in the real sector of the economy of the Stavropol territory, taking into account the main indices, financial indicators and ratios, points to the prevalence of favorable trends (Table 2).
| Trend and evaluation factors of TOP-1000 enterprises | Specific share of factor, % |
| Rate of growth (decline) in the average size of net assets | |
| Increase / decrease in the share of enterprises with negative values of net assets | |
| Rate of growth (decline) in the average size of revenue | |
| Concentration level of capital | |
| Rate of growth (decline) in the average size of profit (loss) | |
| Growth / decline in average values of companies’ net profit | |
| Growth / decline in average values of companies’ net loss | |
| Increase / decrease in average values of total liquidity ratio | |
| Increase / decrease in average values of return on investment ratio | |
| Increase / decrease in average values of asset turnover ratio, times | |
| Share of small and medium-sized businesses in the region in terms of revenue being more than 30% | |
| Regional concentration | |
| Financial position (the largest share) | |
| Solvency index Globas (the largest share) | |
| Industrial production index | |
| Average value of the specific share of factors | |
![]() — positive trend (factor),
— positive trend (factor), ![]() — negative trend (factor).
— negative trend (factor).