Changed in legislation
The Federal law No. 282-FL of August 02, 2019 adopted the amendments to the Law “On licensing certain types of activities”.
The amendments provided for the licensing of the following activities:
- purchase from individuals of jewelry and other products made of precious metals and precious stones, scrap of these products;
- processing or recycling of scrap and waste of precious metals, except scrap and waste generated and collected by organizations and individual entrepreneurs during self-production, or jewelry and other self-produced products from precious metals, not sold and returned to manufacturers.
We informed about these amendments in our publication “Amendments to the Licensing act” of September 16, 2019.
According to the amendments, legal entities and individual entrepreneurs must issue the appropriate licenses, or terminate their activities no later than February 2, 2021.
By Decree of the Government of the Russian Federation of September 12, 2020 No. 1418, two Provisions were approved:
1 Provision on licensing the processing (recycling) of scrap and waste of precious metals (except processing (recycling) by companies and individual entrepreneurs of scrap and waste of precious metals formed and collected by them in the process of self-production, as well as self-produced jewelry and other products from precious metals, not sold and returned to the manufacturer);
2 Provision on licensing the purchase of jewelry and other items made of precious metals and precious stones and scrap of such items from individuals.
In accordance with these Provisions, license applicants must meet the following requirements:
- availability of buildings, facilities, structures and premises or their parts, in each of the places where activities are carried out, owned by property rights or other legal basis;
- availability of the necessary weighing equipment, owned by property rights or other legal basis;
- availability of at least one employee with a higher or secondary vocational education on "Technology of materials" or additional vocational education under the advanced training program (more than 72 hours) in the field of licensed activity or with at least one year of work experience in this area. This requirement does not apply to individual entrepreneurs filing for the license to themselves;
- availability of accounting systems, storage and preservation of precious metals.
A state fee is charged for the issuance and renewal of license, or the issuance of duplicates of them.
Until the RF Government approves the criteria for assigning these types of activities to a certain risk category, scheduled inspections of licensing control are not provided.
The licensing of these types of activities is carried out by the Federal Assay Chamber.
The subscribers of the Information and Analytical system Globas have access to all available information (including archive data) about entities engaged in the processing or recycling of scrap and waste of precious metals.
Trends in recycling of precious metals
Information agency Credinform has prepared a review of trends of the largest Russian companies engaged in recycling of scrap and waste of precious metal.
The largest companies (TOP-500) in terms of annual revenue were selected for the analysis according to the data from the Statistical Register and the Federal Tax Service for the latest available periods (2014-2019). The analysis was based on the data of the Information and Analytical system Globas.
Net assets are total assets less total liabilities. This indicator reflects the real value of the property of an enterprise. When the company’s debt exceeds the value of its property, the indicator is considered negative (insufficiency of property).
The largest company in term of net assets is JSC INCORPARATED ELECTROTECHNICAL PLANTS, INN 7716523950, Moscow. In 2019, net assets value of the company amounted to 3,4 billion RUB.
The lowest net assets value among TOP-500 belonged to LLC LOMPROM ROSTOV, INN 6155043760, Rostov region. In 2019, insufficiency of property of the organization was indicated in negative value of -6,2 billion RUB.
Covering the six-year period, the average net assets values have a trend to decrease with an increasing growth rate (Picture 1).
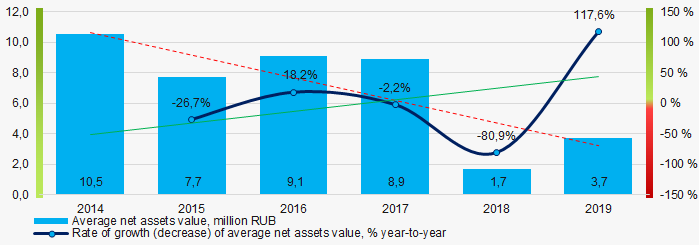 Picture 1. Change in industry average net assets value in 2014 – 2019
Over the past six years, the share of companies with insufficient property had a trend to decrease (Picture 2).
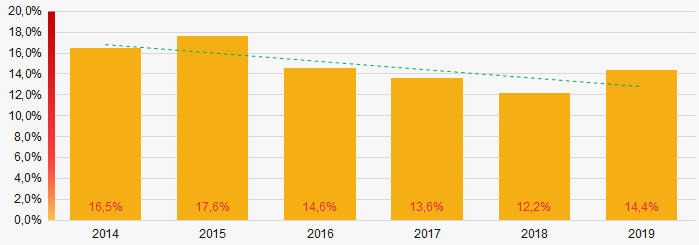 Picture 2. Shares of TOP-500 companies with negative net assets value in 2014-2019
Sales revenue
In 2019, the revenue volume of 10 largest companies of the industry was 59% of total TOP-500 revenue (Picture 3). This is indicative of relatively high level of monopolization in the industry.
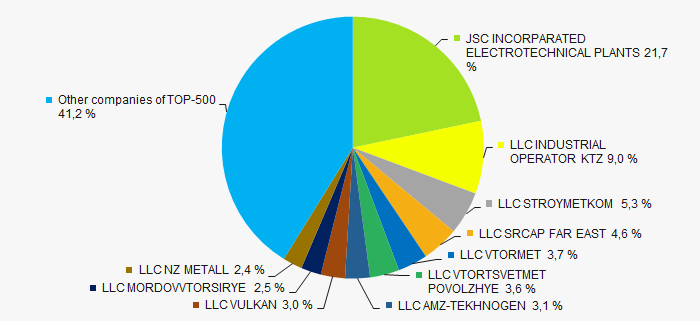 Picture 3. The share of TOP-10 companies in total 2019 revenue of TOP-500
In general, there is a trend to increase in revenue with increasing growth rate (Picture 4).
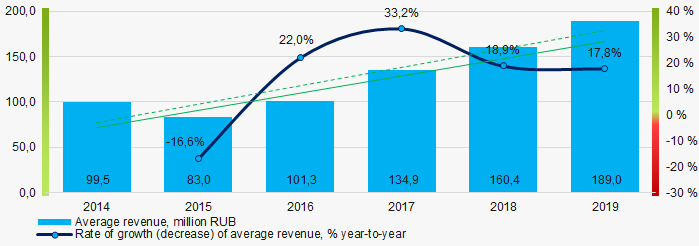 Picture 4. Change in industry average net profit in 2014 – 2019
Profit and loss
The largest organization in term of net profit is JSC INCORPARATED ELECTROTECHNICAL PLANTS, INN 7716523950, Moscow. The company’s profit for 2019 reached 272 million RUB.
Covering the six-year period, there is a trend to increase in average net profit with decreasing growth rate (Picture 5).
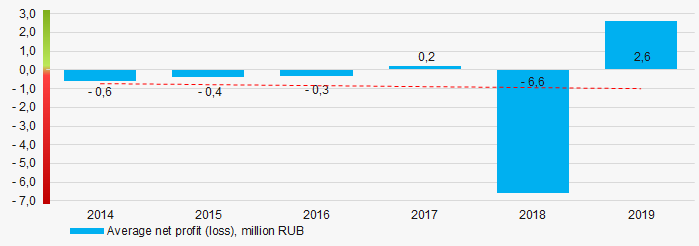 Picture 5. Change in industry average net profit (loss) values in 2014 – 2019
For the six-year period, the average net profit values of TOP-5400 have the increasing trend with the increasing net loss (Picture 6).
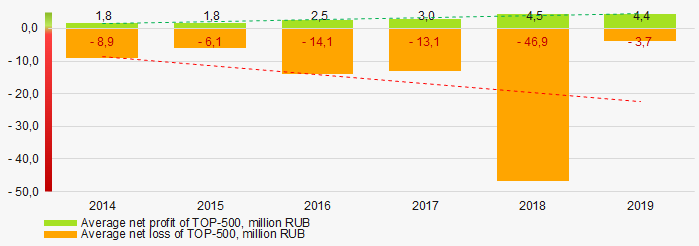 Picture 6. Change in average net profit and net loss of ТОP-500 in 2014 – 2019
Key financial ratios
Covering the six-year period, the average values of the current liquidity ratio were above the recommended one - from 1,0 to 2,0 with a trend to increase (Picture 7).
ROI ratio is calculated as net profit to sum of shareholders equity and long-term liabilities, and shows the return of equity involved in commercial activities and long-term borrowed funds.
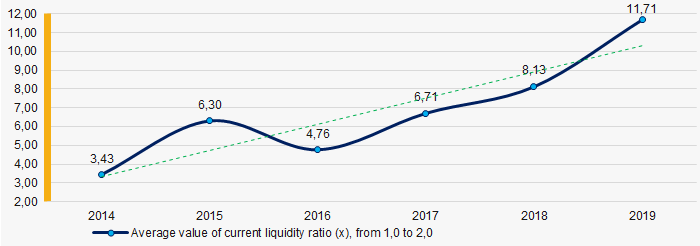 Picture 7. Change in industry average values of current liquidity ratio in 2014 – 2019
Covering the six-year period, the average values of ROI ratio have a trend to decrease (Picture 8).
ROI ratio is calculated as net profit to sum of shareholders equity and long-term liabilities, and shows the return of equity involved in commercial activities and long-term borrowed funds.
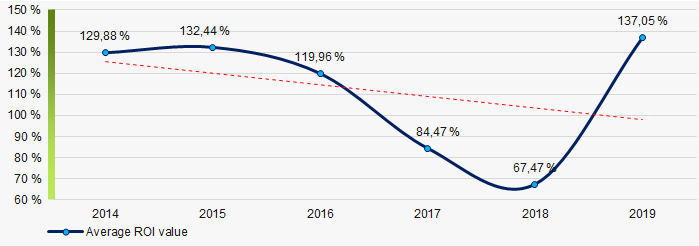 Picture 8. Change in industry average values of ROI ratio in 2014 – 2019
Assets turnover ratio is the ratio of sales revenue and company’s average total assets for a period. It characterizes the effectiveness of using of all available resources, regardless the source of their attraction. The ratio shows how many times per year the full cycle of production and circulation is performed, generating the corresponding effect in the form of profit.
Covering the six-year period, business activity ratio demonstrated the decreasing trend (Picture 9).
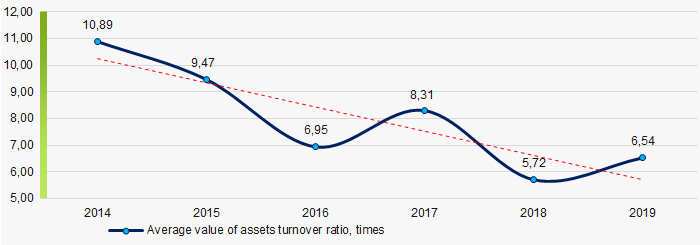 Picture 9. Change in average values of assets turnover ratio in 2014 – 2019
Small business
96% of TOP-1000 organizations are registered in the Register of small and medium-sized enterprises of the Federal Tax Service of the Russian Federation. Their share in total revenue of TOP-500 is 40% that is almost double the national average in 2018-2019 (Picture 10).
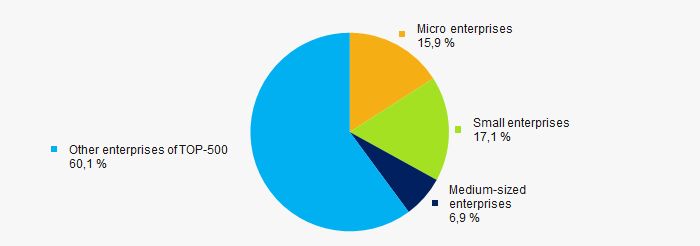 Picture 10. Shares of revenue of small and medium-sized enterprises in TOP-500
Main regions of activity
Companies of TOP-500 are registered in 72 regions of Russia, and unequally located across the country. Almost 78% of companies largest by revenue are located in 10 regions (Picture 11).
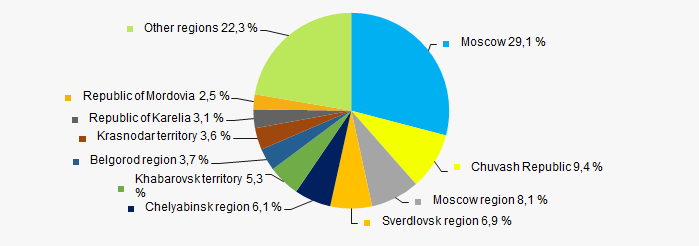 Picture 11. Distribution of TOP-500 revenue by regions of Russia
Financial position score
Assessment of the financial position of TOP-500 companies shows that the majority of them have average financial position (Picture 12).
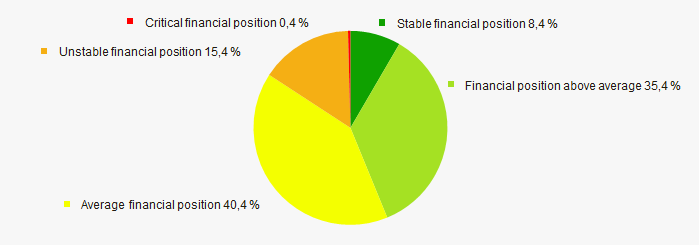 Picture 12. Distribution of TOP-1000 companies by financial position score
Solvency index Globas
Most of TOP-500 companies got Superior / High and Strong / Medium index Globas. This fact shows their ability to meet their obligations fully (Picture 13).
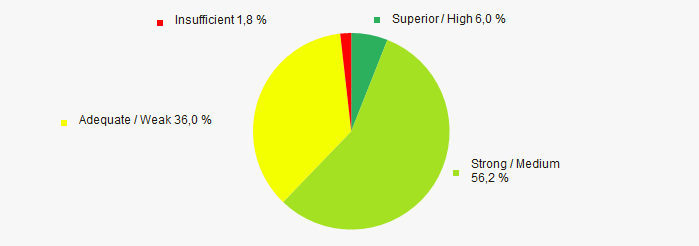 Picture 13. Distribution of TOP-500 companies by solvency index Globas
Conclusion
Complex assessment of activity of the largest Russian companies engaged in recycling of scrap and waste of precious metal, taking into account the main indexes, financial ratios and indicators, demonstrates the prevalence of positive trends in the industry in 2014 - 2019 (Table 1).
| Trends and evaluation factors | Relative share of factors, % |
| Dynamics of the average net assets value |  -10 -10 |
| Rate of growth (decrease) in the average size of net assets |  10 10 |
| Increase (decrease) in the share of enterprises with negative values of net assets |  10 10 |
| Level of competition / monopolization |  -10 -10 |
| Dynamics of the average revenue |  10 10 |
| Rate of growth (decrease) in the average size of revenue |  10 10 |
| Dynamics of the average profit (loss) |  -10 -10 |
| Growth / decline in average values of companies’ net profit |  10 10 |
| Growth / decline in average values of companies’ net loss |  -10 -10 |
| Increase / decrease in average values of total liquidity ratio |  5 5 |
| Increase / decrease in average values of return on investment ratio |  -5 -5 |
| Increase / decrease in average values of asset turnover ratio, times |  -10 -10 |
| Share of small and medium-sized businesses in terms of revenue being more than 22% |  10 10 |
| Regional concentration |  -10 -10 |
| Financial position (the largest share) |  5 5 |
| Solvency index Globas (the largest share) |  10 10 |
| Average value of relative share of factors |  0,9 0,9 |
 positive trend (factor),
  negative trend (factor).