
Order a report
Custom-made industry research, company ratings, competitor analysis


Trends in the activity of companies, producing computers, electronic and optical products
Information agency Credinform represents an overview of trends in the activity of companies, producing computers, electronic and optical products.
Enterprises with the largest volume of annual revenue, producing computers, electronic and optical products (TOP-10 and TOP-1000), were selected for the analysis, according to the data from the Statistical Register for the latest available periods (for 2015 and 2016). The analysis was made on the basis of the data of the Information and Analytical system Globas.
Net assets
The indicator, reflecting the real value of company’s property, is calculated annually as the difference between assets on the enterprise balance and its debt obligations. The indicator of net assets is considered negative (insufficiency of property), if company’s debt exceeds the value of its property.
| № in TOP-1000 | Name, INN, region | Net assets value, mln RUB.* | Solvency index Globas | ||
| 2014 | 2015 | 2016 | |||
| 1 | 2 | 3 | 4 | 5 | 6 |
| 1. | SAMSUNG ELECTRONICS RUS KALUGA LLC INN 4025413896 Kaluga region |
28 764 | 31 504 | 37 868 | 197 High |
| 2. | MIKRON PJSC INN 7735007358 Moscow |
10 823 | 6 058 | 10 440 | 284 Medium |
| 3. | OMSKOE PROIZVODSTVENNOE OBYEDINENIE "RADIOZAVOD IMENI A.S. POPOVA" (RELERO) PJSC INN 5508000095 Omsk region |
5 200 | 5 693 | 5 877 | 193 High |
| 4. | TECHNOLOGY COMPANY SCHLUMBERGER LLC INN 7709413265 Tyumen region |
7 023 | 8 870 | 5 253 | 246 Strong |
| 5. | THE CONCERN ENERGOMERA JSC INN 2635025450 Stavropol territory |
5 271 | 5 296 | 5 183 | 212 Strong |
| 996. | AMBER LLC INN 3911003717 Kaliningrad region |
-301 | -544 | -217 | 320 Adequate |
| 997. | ZAVOD YUPITER NJSC INN 7838027959 Novgorod region |
-99 | -126 | -237 | 334 Adequate |
| 998. | TOMSK RADIO ENGINEERING FACTORY PJSC INN 7017085397 Tomsk region |
-282 | -285 | -309 | 600 Insufficient |
| 999. | SARANSK TELEVISION PLANT PJSC INN 1327156079 Republic of Mordovia |
1 156 | 1 376 | -972 | 287 Medium |
| 1000. | ANGSTREM-T PJSC INN 7735128151 Moscow |
-2 773 | -35 604 | -25 517 | 308 Adequate |
*) – the indicators of growth or decline to the previous period are marked in columns 4 and 5 with green and red fillings, respectively.
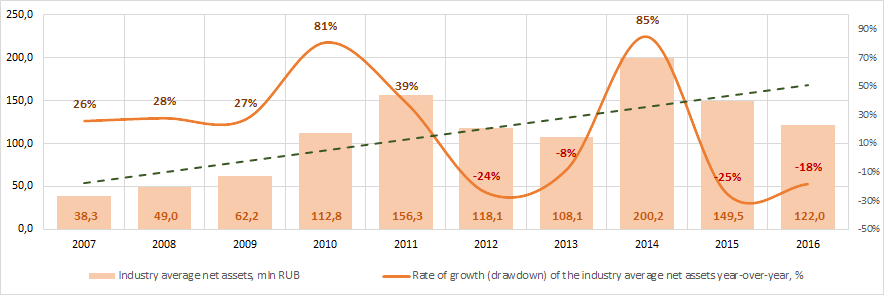 Picture 1. Change in the industry average indicators of the net asset value of companies, producing computers, electronic and optical products, in 2007 – 2016
Sales revenue
The revenue of 10 industry leaders made 25% of the total revenue of TOP-1000 companies in 2016. It points to a relatively high level of competition in the industry (Picture 2).
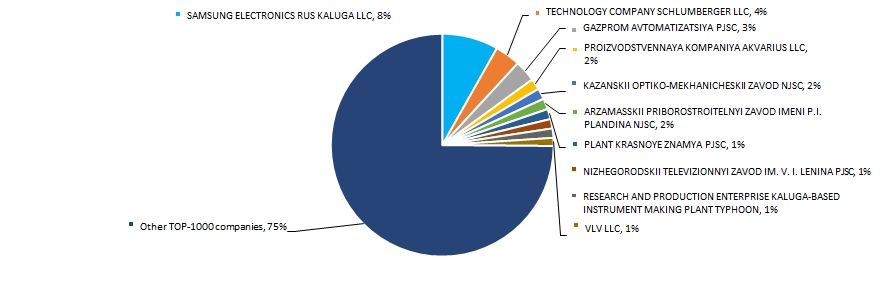 Picture 2. Shares of participation of TOP-10 companies in the total revenue of TOP-1000 companies for 2016
In general, there is a trend towards an increase in volume revenue (Picture 3).
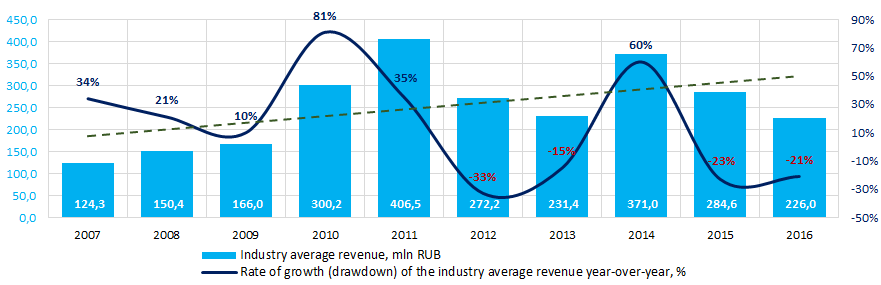 Picture 3. Change in the industry average revenue of companies, producing computers, electronic and optical products, in 2007 – 2016
Profit and losses
The profit volume of 10 industry leaders in 2016 made 42% of the total profit of TOP-1000 companies (Picture 4).
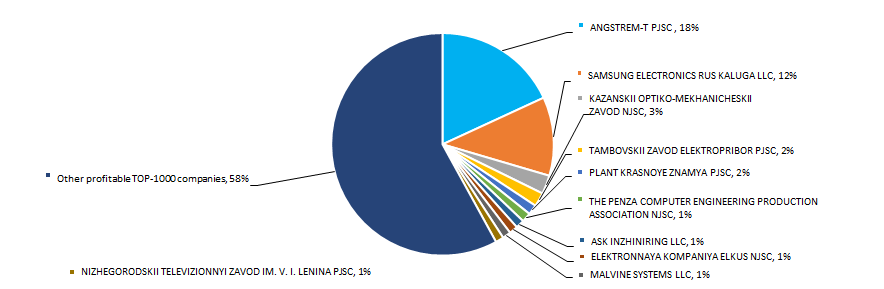 Picture 4. Share of participation of TOP-10 companies in the total volume of profit of TOP-1000 companies for 2016
Industry average profit’s indicators of companies of the industry for the ten-year period trend to increase (Picture 5).
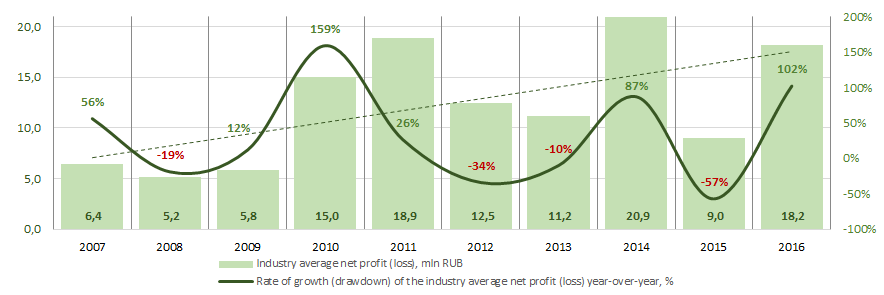 Picture 5. Change in the industry average indicators of profit of companies, producing computers, electronic and optical products, in 2007 – 2016
Over a three-year period, the average values of profit indicators of TOP-1000 companies tends to increase, and the average value of net loss decreases (Picture 6).
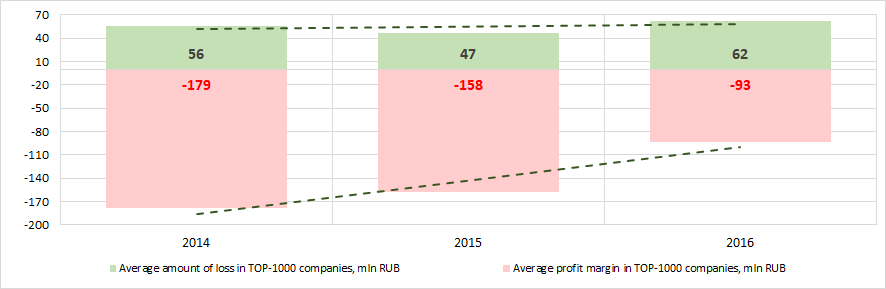 Picture 6. Change in the industry average indicators of profit and loss of the largest companies, producing computers, electronic and optical products, in 2014 – 2016
Key financial ratios
Over the ten-year period the industry average indicators of the total liquidity ratio were in the range of recommended values — from 1,0 up to 2,0 (Picture 7). In general, the ratio indicator tends to increase.
The total liquidity ratio (the relation of the amount of current assets to short-term liabilities) shows the sufficiency of company’s funds for repayment of its short-term liabilities.
The experts of the Information agency Credinform, taking into account the actual situation both in the economy as a whole and in the sectors, has developed and implemented in the Information and Analytical system Globas the calculation of practical values of financial ratios that can be recognized as normal for a particular industry. For companies, producing computers, electronic and optical products, the practical value of the total liquidity ratio made from 1,00 up to 4,06 in 2016.
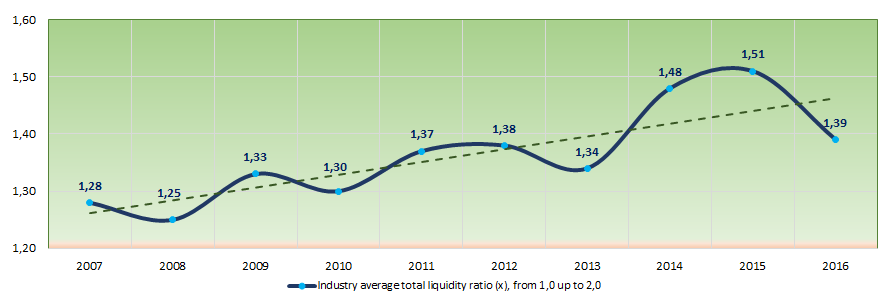 Picture 7. Change in the average industry values of the total liquidity ratio of companies, producing computers, electronic and optical products, in 2007 – 2016
There has been an instability observed in indicators of the return on investment ratio, for ten years, with a tendency to decrease (Picture 7). The ratio is calculated as the relation of net profit to the sum of own capital and long-term liabilities and demonstrates the return on the equity involved in the commercial activity of own capital and the long-term borrowed funds of an organization.
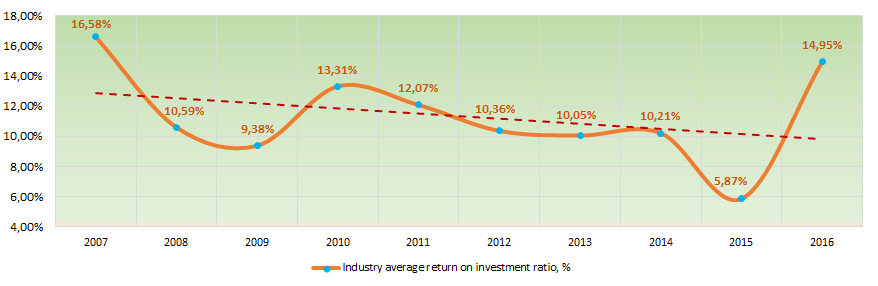 Picture 8. Change in the average industry values of the return on investment ratio of companies, producing computers, electronic and optical products, in 2007 – 2016
Asset turnover ratio is calculated as the relation of sales proceeds to the average value of total assets for a period and characterizes the efficiency of use of all available resources, regardless of the sources of their attraction. The ratio shows how many times a year a complete cycle of production and circulation is made, yielding profit.
As a whole, this business activity ratio showed a tendency to decrease over the ten-year period (Picture 9).
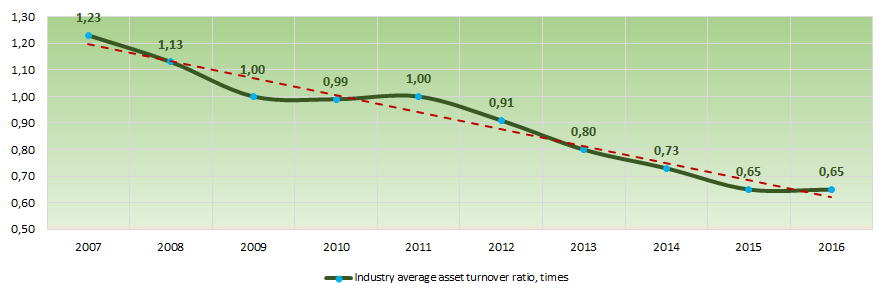 Picture 9. Change in the average industry values of the asset turnover ratio of companies, producing computers, electronic and optical products, in 2007 – 2016
Production structure
The largest share in the total revenue of TOP-1000 is owned by companies, specializing in the manufacture of navigation, measuring and control appliances and devices and the manufacture of watches (Picture 10).
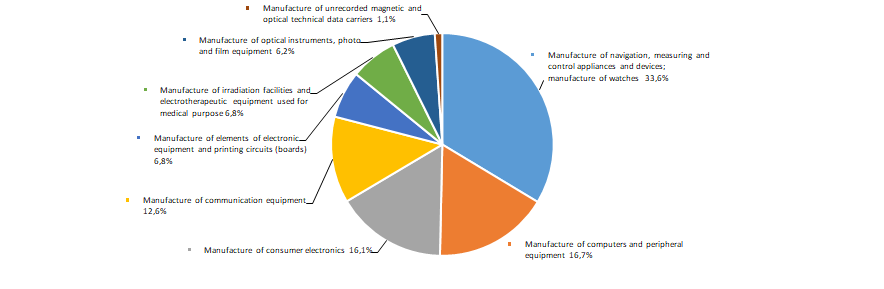 Picture 10. Distribution of types of activity in the total revenue of TOP-1000 companies, %
Main regions of activity
TOP-1000 companies are unequally distributed across the Russian territory and registered in 64 regions (Picture 11).
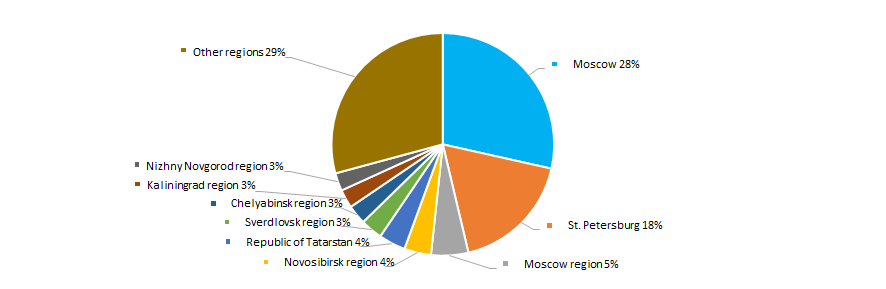 Picture 11. Distribution of TOP-1000 companies by regions of Russia
Financial position score
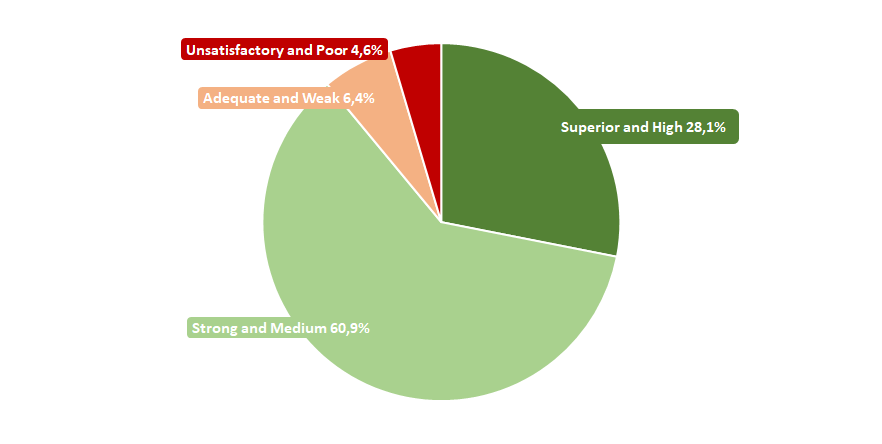
An assessment of the financial position of companies in the industry shows that the largest number is in a stable financial position and above the average (Picture 12).
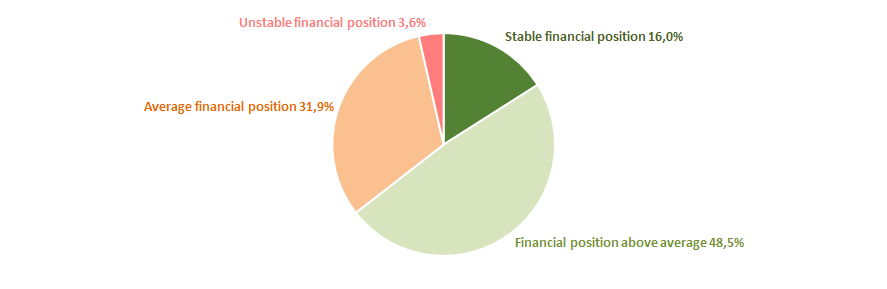 Picture 12. Distribution of TOP-1000 companies by financial position score
Solvency index Globas
Most of TOP-1000 companies got High or Strong/Medium Solvency index Globas, that points to their ability to repay their debts in time and fully (Picture 13).
 Picture 13. Distribution of TOP-1000 companies by solvency index Globas
Thus, a comprehensive assessment of enterprises, producing computers, electronic and optical products, taking into account the main indices, financial indicators and ratios, points to the prevalence of favorable trends in the industry.