Audit of financial statements for small businesses
Information agency Credinform has prepared a review of trends in activity of companies that meet the criteria for mandatory audit of financial statements.
The largest companies (ТОP-500) that meet the updated criteria for mandatory audit of financial statements in terms of annual revenue were selected according to the data from the Statistical Register and the Federal Tax Service for the latest available periods (2014 - 2019). The company selection and analysis were based on data of the Information and Analytical system Globas.
Net assets is a ratio reflecting the real value of company's property. It is calculated annually as the difference between assets on the enterprise balance and its debt obligations. The ratio is considered negative (insufficiency of property), if company’s debt exceeds the value of its property.
The largest company in terms of net assets is JSC INDUSTRIAL RECONSTRUCTION AND DEVELOPMENT OIL FUND, INN 7702028070, Moscow. In 2019 net assets of the company amounted to 26 billion RUB.
The smallest size of net assets in TOP-500 had LLC STIMUL-T, INN 7017007293, Tomsk region. The lack of property of the company in 2019 was expressed in negative terms -7 billion RUB.
For the last six years, the average industry values of net assets showed the growing tendency with negative dynamics of growth rates (Picture 1).
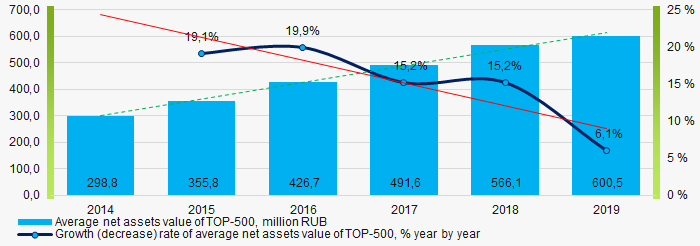 Picture 1. Change in average net assets value in 2014 – 2019
For the last six years, the share of ТОP-500 enterprises with lack of property is decreasing (Picture 2).
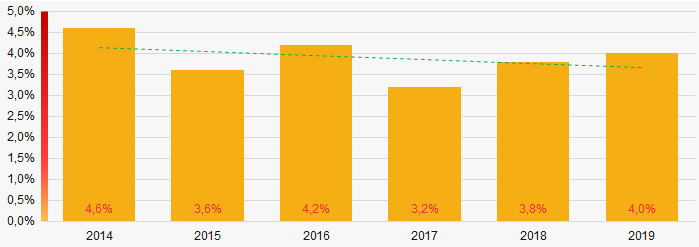 Picture 2. The share of enterprises with negative net assets value in ТОP-500 in 2014-2019
Sales revenue
In 2019, the total revenue of 10 largest companies amounted to 11% from ТОP-500 total revenue (Picture 3). This fact testifies the high level of capital concentration within this group of enterprises.
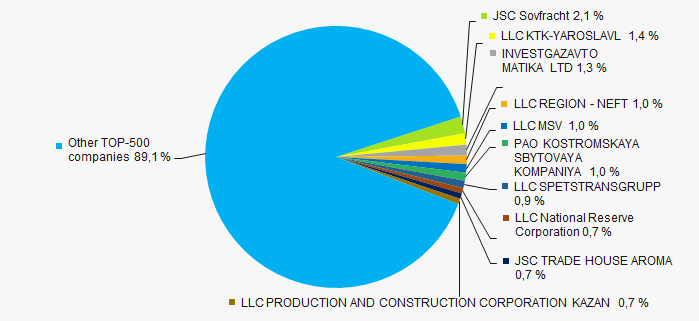 Picture 3. Shares of TOP-10 in TOP-500 total revenue for 2019
n general, the growing trend in sales revenue with negative dynamics of growth rates is observed (Picture 4).
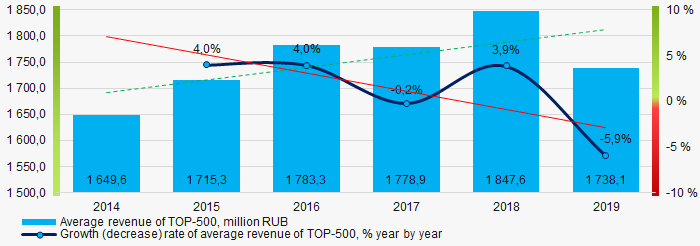 Picture 4. Change in average revenue in 2014 – 2019
 Profit and loss
The largest company in terms of net profit is also JSC INDUSTRIAL RECONSTRUCTION AND DEVELOPMENT OIL FUND, INN 7702028070, Moscow. In 2019 the company’s profit amounted to 4 billion RUB.
For the last six years, the average profit values show the growing tendency with negative dynamics of growth rates (Picture 5).
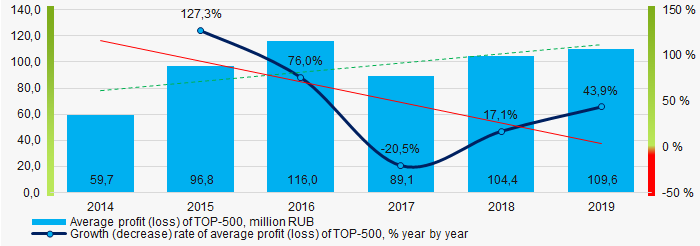 Picture 5. Change in average profit (loss) in 2014 – 2019
Over a six-year period, the average net profit values of ТОP-500 show the growing tendency, along with this the average net loss is decreasing (Picture 6).
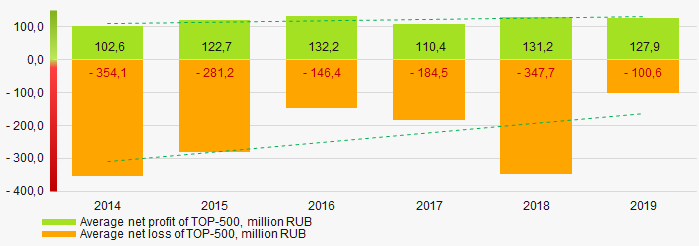 Picture 6. Change in average net profit/loss of ТОP-500 companies in 2014 – 2019
Main financial ratios
For the last six years, the average values of the current liquidity ratio were higher than the recommended values - from 1,0 to 2,0, with growing trend (Picture 7).
The current liquidity ratio (ratio of total working capital to short-term liabilities) shows the sufficiency of company’s assets to meet short-term obligations.
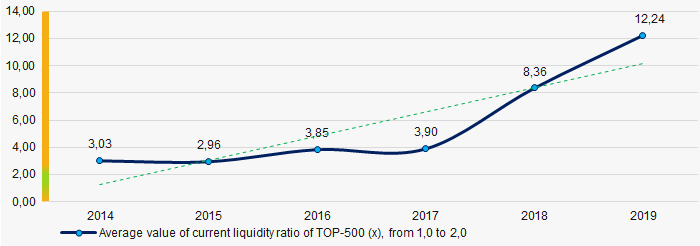 Picture 7. Change in average values of current liquidity ratio in 2014 – 2019
Within six years, the downward trend of the average values of ROI ratio is observed (Picture 8).
The ROI ratio is calculated as a ratio of net profit to sum of stockholder equity and long-term liabilities and shows the return from equity involved in commercial activities and long-term borrowed funds.
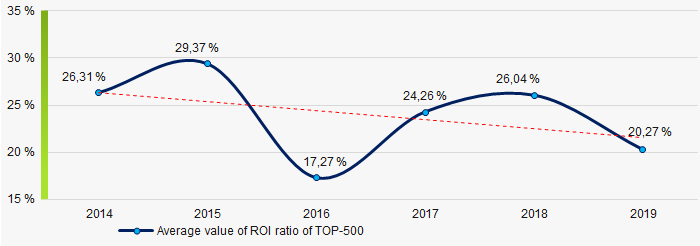 Picture 8. Change in average values of ROI ratio in 2014 – 2019
Assets turnover ratio is the ratio of sales revenue and company’s average total assets for a period. It characterizes the effectiveness of using of all available resources, regardless the source of their attraction. The ratio shows how many times per year the full cycle of production and circulation is performed, generating the corresponding effect in the form of profit.
For the last six years, this business activity ratio demonstrated the decreasing trend (Picture 9).
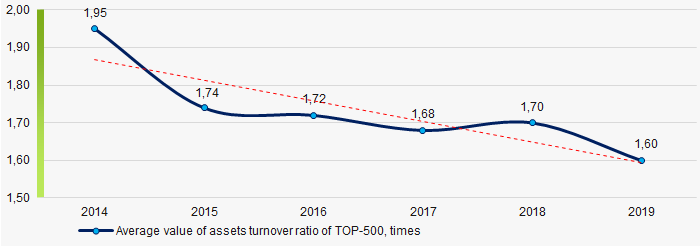 Picture 9. Change in average values of assets turnover ratio in 2014 – 2019
Main regions of activity
ТОP-500 companies are unequally located across the country and registered in 66 regions of Russia. More than 47% of the largest enterprises in terms of revenue are located in Moscow, Moscow region and Saint Petersburg Picture 10).
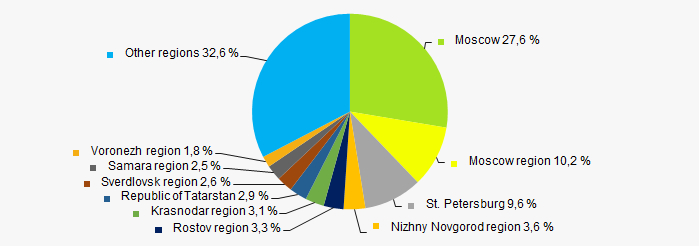 Picture 10. Distribution of TOP-500 revenue by the regions of Russia
Financial position score
An assessment of the financial position of TOP-500 companies shows that almost the half has above average financial position (Picture 11).
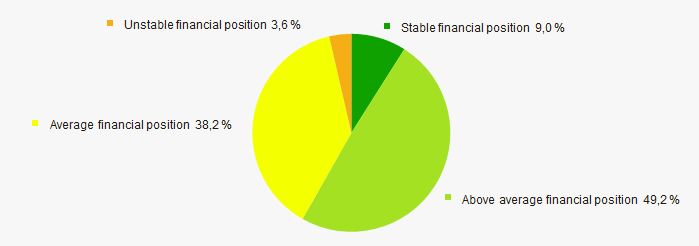 Picture 11. Distribution of TOP-500 companies by financial position score
Solvency index Globas
Most of TOP-500 companies got superior/high and strong/medium Solvency index Globas, this fact shows the ability of the companies to meet their obligations in time and fully (Picture 12).
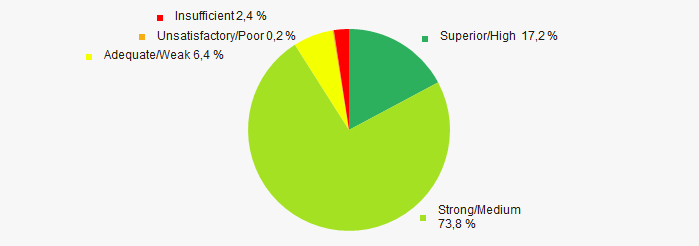 Picture 12. Distribution of TOP-500 companies by Solvency index Globas
Conclusion
A complex assessment of small businesses that meet the criteria for mandatory audit of financial statements, taking into account the main indexes, financial ratios and indicators, demonstrates the presence of positive trends within 2014-2019 (Table 1).
| Trends and assessment factors | Relative share, % |
| Dynamics of average net assets value |  10 10 |
| Growth/drawdown rate of average net assets value |  -10 -10 |
| Increase / decrease in the share of enterprises with negative net assets |  10 10 |
| The level of capital concentration |  10 10 |
| Dynamics of average net profit |  10 10 |
| Growth/drawdown rate of average revenue |  -10 -10 |
| Dynamics of average profit (loss) |  10 10 |
| Growth/drawdown rate of average profit (loss) |  -10 -10 |
| Increase / decrease in average net profit of companies |  10 10 |
| Increase / decrease in average net loss of companies |  10 10 |
| Increase / decrease in average values of current liquidity ratio |  5 5 |
| Increase / decrease in average values of ROI ratio |  -10 -10 |
| Increase / decrease in average values of assets turnover ratio, times |  -10 -10 |
| Regional concentration |  -10 -10 |
| Financial position (the largest share) |  10 10 |
| Solvency index Globas (the largest share) |  10 10 |
| Average value of factors |  2,2 2,2 |
 favorable trend (factor),
  unfavorable trend (factor)
Liabilities and assets in construction
Information agency Credinform represents a ranking of the largest construction companies having a potential opportunity to carry out a tax monitoring. The companies engaged in construction of buildings and structures meeting the new criteria for tax monitoring with the largest volume of annual revenue (TOP-10 and TOP-100) were selected for the ranking, according to the data from the Statistical Register and the Federal Tax Service for the latest available periods (2017 - 2019). They were ranked by the ratio of assets and liabilities (Table 1). The selection and analysis was based on the data of the Information and Analytical system Globas.
Liabilities to assets ratio shows the share of assets financed by loans. The standard value for this ratio is from 0.2 to 0.5
Sales revenue and net profit show the scale of the company and the efficiency of its business, and the ratio of liabilities and assets indicates the risk of insolvency of the company.
Exceeding the upper standard value indicates excessive debt load, which can stimulate development, but negatively affects the stability of the financial position. If the value is below the standard value, this may indicate a conservative strategy of financial management and excessive caution in attracting new borrowed funds.
In order to get the most comprehensive and fair picture of the financial standing of an enterprise it is necessary to pay attention to all combination of indicators and financial ratios.
| Name, INN, region | Revenue, million RUB | Net profit (loss), million RUB | Ratio of liabilities and assets (x), from 0,2 to 0,5 | Solvency index Globas | |||
| 2018 | 2019 | 2018 | 2019 | 2018 | 2019 | ||
| 1 | 2 | 3 | 4 | 5 | 6 | 7 | 8 |
| MONARCH INN 7714950480 Moscow |
 18 910 18 910 |
 17 436 17 436 |
 127 127 |
 116 116 |
 0,95 0,95 |
 0,98 0,98 |
233 Strong |
| OOO MIP-STROI #1 INN 7701394860 Moscow |
 56 995 56 995 |
 53 932 53 932 |
 10 10 |
 99 99 |
 0,98 0,98 |
 0,98 0,98 |
272 Medium |
| JSC PIK-Industries INN 7729755852 Moscow |
 26 948 26 948 |
 44 616 44 616 |
 1 792 1 792 |
 1 263 1 263 |
 1,01 1,01 |
 0,98 0,98 |
275 Medium |
| RENAISSANCE HEAVY INDUSTRIES LLC INN 7802772445 Moscow |
 37 662 37 662 |
 42 884 42 884 |
 4 732 4 732 |
 2 079 2 079 |
 0,83 0,83 |
 0,94 0,94 |
245 Strong |
| Fodd INN 7729355935 Moscow |
 19 640 19 640 |
 23 853 23 853 |
 262 262 |
 314 314 |
 0,97 0,97 |
 0,92 0,92 |
176 High |
| JSC VOSTOKNEFTEZAVODMONTAZH INN 0277015293 Republic of Bashkortostan |
 11 047 11 047 |
 18 231 18 231 |
 82 82 |
 405 405 |
 0,89 0,89 |
 0,88 0,88 |
208 Strong |
| PIK GROUP INN 7713011336 Moscow |
 25 343 25 343 |
 24 572 24 572 |
 15 137 15 137 |
 306 306 |
 0,74 0,74 |
 0,75 0,75 |
233 Strong |
| RENAISSANCE CONSTRUCTION LTD INN 7708185129 Moscow |
 44 512 44 512 |
 25 720 25 720 |
 1 290 1 290 |
 2 676 2 676 |
 0,94 0,94 |
 0,74 0,74 |
201 Strong |
| OOO ENERGO-STROI INN 7801174139 Saint Petersburg |
 8 713 8 713 |
 24 118 24 118 |
 229 229 |
 1 640 1 640 |
 0,92 0,92 |
 0,74 0,74 |
171 Superior |
| LENSPETSSMU INN 7802084569 Saint Petersburg |
 15 270 15 270 |
 17 182 17 182 |
 4 374 4 374 |
 6 441 6 441 |
 0,68 0,68 |
 0,71 0,71 |
217 Strong |
| Average value for TOP-10 |  26 504 26 504 |
 29 254 29 254 |
 2 804 2 804 |
 1 534 1 534 |
 0,89 0,89 |
 0,86 0,86 |
|
| Average value for TOP-100 |  8 802 8 802 |
 7 789 7 789 |
 30 30 |
 -289 -289 |
 0,81 0,81 |
 0,81 0,81 |
|
 growth of indicator to the previous period,
  decrease of indicator to the previous period
The average indicator of the ratio of liabilities and assets of TOP-10 and TOP-100 is above the standard value. Indicators of six companies show the positive dynamic to move toward the standard value in 2019.
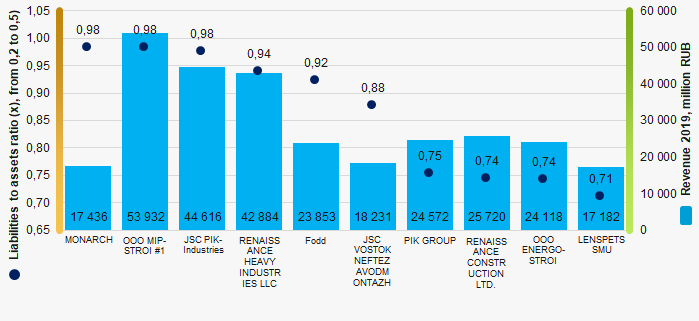 Picture 1. Ratio of liabilities and assets, and revenue of the largest construction companies (TOP-10)
Over the past 6 years, the industry average values of the ratio of liabilities and assets of TOP-100 have a positive trend to move toward the standard value (Picture 2).
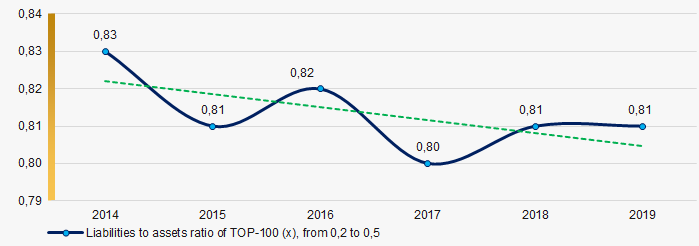 Picture 2. Change in the industry average values of the ratio of liabilities and assets of the TOP-100 largest construction companies in 2014 – 2019