
Order a report
Custom-made industry research, company ratings, competitor analysis


Trends among the largest Russian producers of meat and meat products
Information agency Credinform Credinform represents an overview of trends among the largest Russian producers of meat and meat products.
Producers with the largest volume of annual revenue (TOP-10 and TOP-500) were selected for the analysis, according to the data from the Statistical Register for the latest available periods (2014 — 2016). The analysis was made on the basis of the data of the Information and Analytical system Globas.
Net assets — indicator of real cost of corporate assets, which is annually calculated as the difference between assets of the company and its debt liabilities. If the company’s debts exceed net worth value, net assets indicator is considered negative (insufficiency of property).
| Position in TOP-1000 | Name, INN, region | Net assets value, mln RUB | Solvency index Globas | ||
| 2014 | 2015 | 2016 | |||
| 1 | 2 | 3 | 4 | 5 | 6 |
| 1. | SAMSON CO. LTD INN 7810015329 Saint-Petersburg |
-585,1 | 203 Strong | ||
| 2. | JSC OSTANKINO MEAT PROCESSING PLANT INN 7715034360 Moscow |
5 560,0 | 216 Strong | ||
| 3. | LLC MEAT PROCESSING PLANT “PAVLOVSKAYA SLOBODA” INN 5017041244 Moscow region |
1 551,4 | 184 High | ||
| 4. | MIRATORG ZAPAD LIMITED LIABILITY COMPANY INN 3906072585 Kaliningrad region |
1 509,5 | 161 Superior | ||
| 5. | LIMITED LLABILITY COMPANY PRODUCTION AND COMMERCIAL ASSOCIATION DOMESTIC PRODUCT INN 3923002806 Kaliningrad region |
977,3 | 206 Strong | ||
| 996. | JSC AGRO INVEST INN 7710445247 Moscow region Process of being wound up, 30.09.2016 |
2 250,7 | 600 Insufficient | ||
| 997. | PJSC TVER MEAT PROCESSING PLANT INN 6903027075 Tver region Process of being wound up, 14.10.2013 |
-0,1 | 600 Insufficient | ||
| 998. | JSC LUGA PLANT BELKOZIN INN 4710002063 Leningrad region Process of being wound up, 14.03.2018 |
-159,7 | 600 Insufficient | ||
| 999. | LLC YURAL INN 6726017848 Smolensk region Process of being wound up, 27.05.2016 |
-4,5 | 600 Insufficient | ||
| 1000. | PJSC VELIKOLUKSKY MEAT PROCESSING PLANT INN 6025009824 Pskov region |
-1 404,7 | 240 Strong | ||
Industry average net assets indicators for the ten-year period have a trend to decrease (Picture 1).
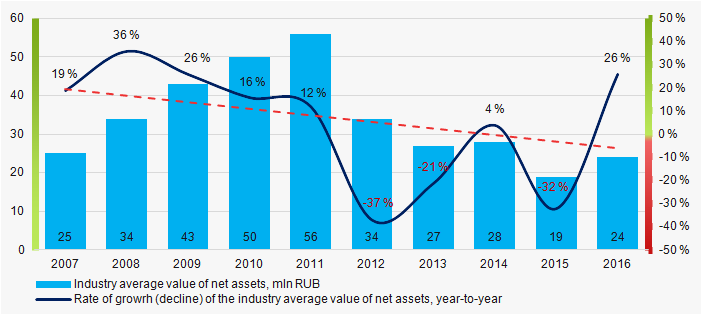 Picture 1. Change in average net assets value of the largest Russian producers of meat and meat products in 2007 — 2016
Sales revenue
The revenue of the largest 10 companies made 23% of the total revenue of TOP-1000 companies in 2016. This indicates relatively high level of business competition in this sector (Picture 2).
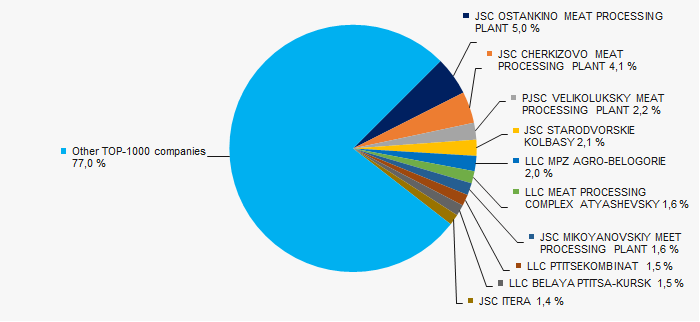 Picture 2. Shares of participation of TOP-10 enterprises in the total revenue of TOP-1000 companies for 2016
Trend to decrease in revenue volume is observed (Picture 3).
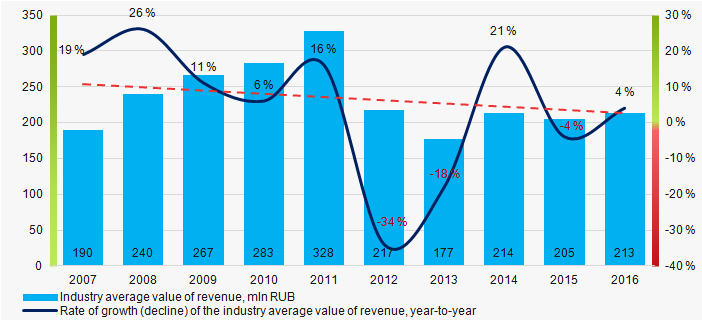 Picture 3. Change in the industry average revenue indicators of the largest Russian producers of meat and meat products in 2007 — 2016
Profit and loss
Profit volume of the largest 10 companies made 68% of the total profit of TOP-1000 companies in 2016 (Picture 4).
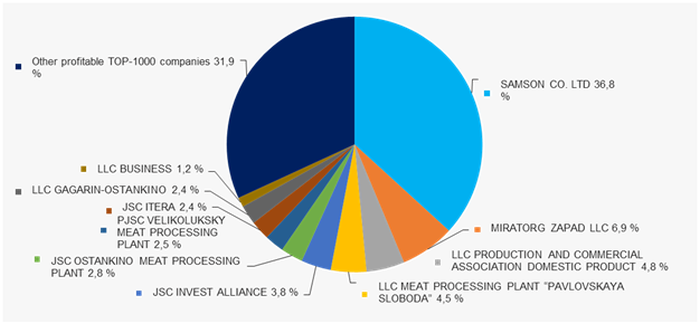 Picture 4. Shares of participation of TOP-10 enterprises in the total profit volume of TOP-1000 companies for 2016
Industry average values of net profit indicators of companies for the ten-year period have a trend to decrease (Picture 5).
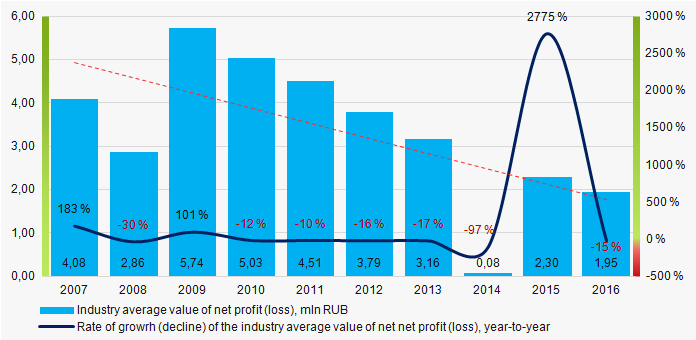 Picture 5. Change in the average net profit indicators of the largest producers of meat and meat products in 2007 — 2016
For the three-year period, the average net profit indicators of TOP-1000 enterprises have a trend to increase; at the same time, the average net loss value increases (Picture 6).
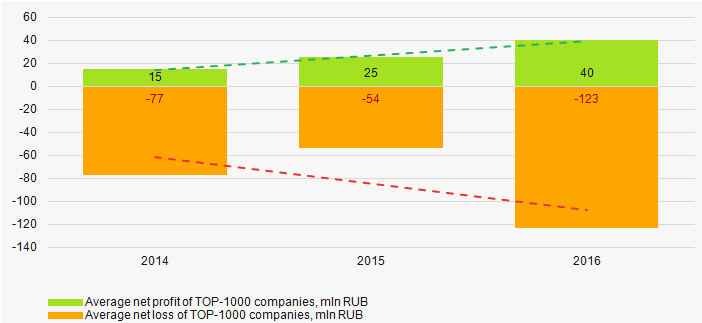 Picture 6. Change in the industry average values of profit and loss of meat and meat products producers in 2014 — 2016
Key financial ratios
The total liquidity ratio (the relation of the amount of current assets to short-term liabilities) shows the sufficiency of company’s funds for repayment of its short-term liabilities.
Over the ten-year period the industry average indicators of the total liquidity ratio were above the range of recommended values — from 1,0 up to 2,0 (Picture 7). In general, the ratio indicator tends to increase.
Taking into account the actual situation both in the economy as a whole and in the sectors, the experts of the Information agency Credinform have developed and implemented in the Information and Analytical system Globas the calculation of practical values of financial ratios that can be recognized as normal for a particular industry.
For producers of meat and meat products the practical value of the total liquidity ratio made from 0,78 up to 2,31.
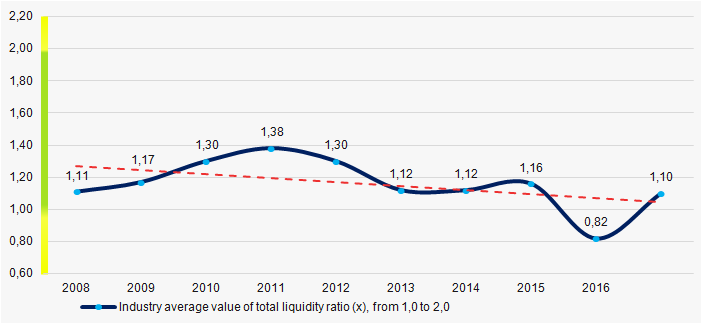 Picture 7. Change in the average values of the total liquidity ratio of meat and meat products producers in 2007 — 2016
The ratio is calculated as the relation of net profit to the sum of own capital and long-term liabilities and demonstrates the return on the equity involved in the commercial activity of own capital and the long-term borrowed funds of an organization.
There has been a trend towards a decrease in indicators of the return on investment ratio for three years (Picture 8).
 Picture 8. Change in the average values of the return on investment ratio of meat and meat products producers in 2007 — 2016
Asset turnover ratio is calculated as the relation of sales proceeds to the average value of total assets for a period and characterizes the efficiency of use of all available resources, regardless of the sources of their attraction. The ratio shows how many times a year a complete cycle of production and circulation is made, yielding profit.
This ratio of business activity showed a trend to decrease over the ten-year period (Picture 9).
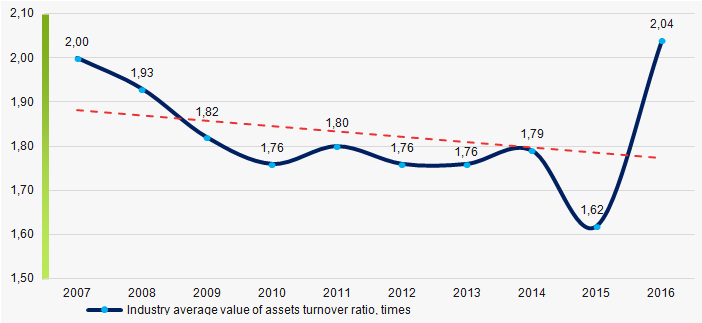 Picture 9. Change in the average values of the asset turnover ratio of meat and meat products producers in 2007 — 2016
Production structure
The largest share in the total revenue of TOP-1000 is owned by companies, specializing in production of butcher and poultry meat products (Picture 10).
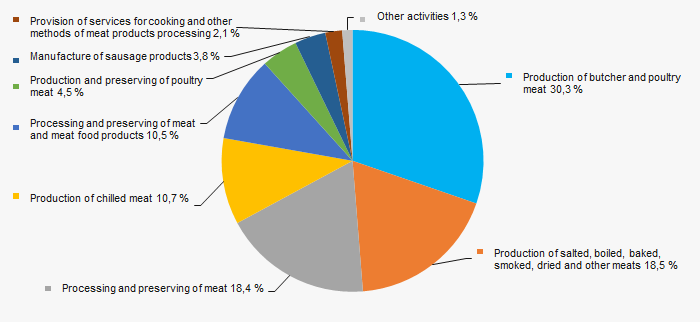 Picture 10. Distribution of types of activity in the total revenue of TOP-1000 companies, %
80% of TOP-1000 companies are registered in the Register of small and medium-sized businesses of the Federal Tax Service of the RF (Picture 11).
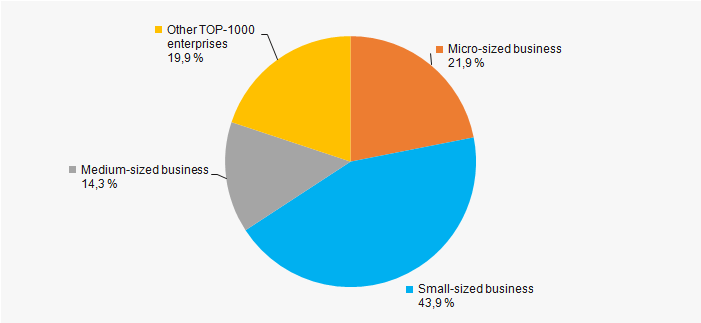 Picture 11. Shares of small and medium-sized businesses in TOP-1000 companies of the industry, %
Main regions of activity
Companies of TOP-1000 are spotty located across the country and registered in 77 regions of Russia (Picture 12).
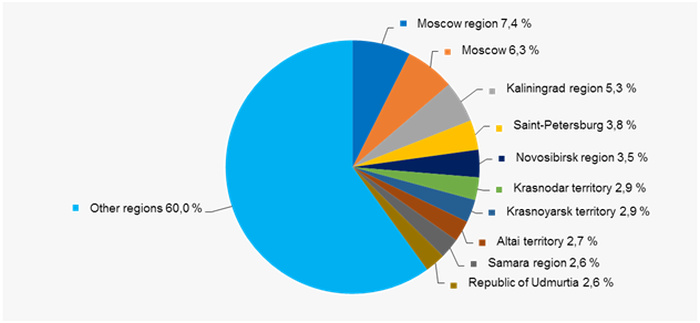 Picture 12. Distribution of TOP-1000 companies by the regions of Russia
Financial position score
An assessment of the financial position of companies in the industry shows that the majority of them have stable financial position and financial position above average (Picture 13).
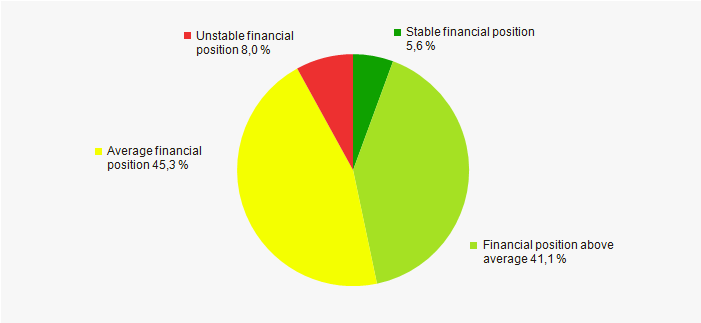 Picture 13. Distribution of TOP-1000 companies by financial position score
Solvency index Globas
Most of TOP-1000 companies got Superior/High or Strong/Medium Solvency index Globas, that indicates their ability to pay off debts in time and fully (Picture 14).
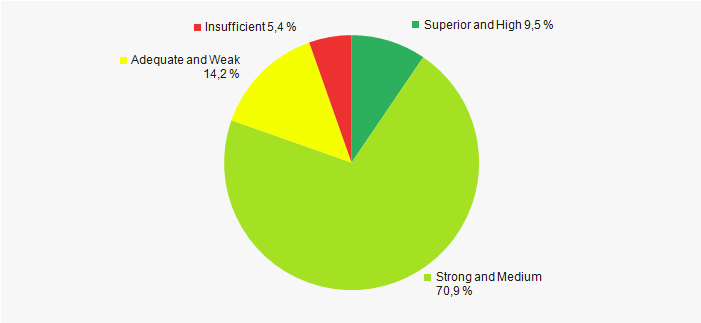 Picture 14. Distribution of TOP-1000 companies by solvency index Globas
Conclusion
A comprehensive assessment of activity of the largest Russian producers of meat and meat products, taking into account the main indices, financial indicators and ratios, indicates the prevalence of unfavorable trends in the industry. Declining net assets, revenue, profit and key financial ratios are alarming factors.