
Order a report
Custom-made industry research, company ratings, competitor analysis


Trends in electronic industry
Information agency Credinform has observed trends in the activity of the largest Russian manufacturers of electronic and optical products.
Manufacturers of computers, electronic and optical products with the largest volume of annual revenue (TOP-10 and TOP-1000), were selected for the analysis, according to the data from the Statistical Register for the latest available periods (for 2015-2017). The analysis was made on the basis of the data of the Information and Analytical system Globas.
Net assets - indicator, reflecting the real value of company's property, is calculated annually as the difference between assets on the enterprise balance and its debt obligations. The indicator of net assets is considered negative (insufficiency of property), if company’s debt exceeds the value of its property.
| № | Name, INN, region, main type of activity | Net assets value, bln RUB | Solvency index Globas | ||
| 2015 | 2016 | 2017 | |||
| 1 | 2 | 3 | 4 | 5 | 6 |
| 1 | LLC SAMSUNG ELECTRONICS RUS KALUGA INN 4025413896 Kaluga region Manufacture of television receivers including video monitors and projectors |
31,50 | |
|
185 High |
| 2 | JSC IZHEVSK ELECTROMECHANICAL PLANT KUPOL INN 1831083343 the Udmurt Republic Manufacture of radio- and television receiving transmitting equipment |
13,50 | |
|
222 Strong |
| 3 | JSC MIKRON INN 7735007358 Moscow Manufacture of parts of electronic equipment |
6,06 | |
|
260 Medium |
| 4 | JSC Research and innovation company BOLID INN 5018000402 Moscow region Manufacture of secure and fire alarms and similar equipment |
6,13 | |
|
153 Superior |
| 5 | JSC SCIENTIFIC AND PRODUCTION ASSOCIATION ALMAZ NAMED AFTER ACADEMICIAN A.A. RASPLETIN INN 7712040285 Moscow Manufacture of radio- and television receiving transmitting equipment |
6,76 | |
|
193 High |
| 996 | JSC STATE SPECIALIZED DESIGN INSTITUTE INN 7708697977 Moscow Manufacture of control and measuring and navigation devices and equipment; manufacture of watches |
0,46 | |
|
273 Medium |
| 997 | JSC YUPITER PLANT INN 7838027959 Novgorod region Manufacture of optical equipment, photo- and film equipment |
-0,13 | |
|
321 Adequate |
| 998 | LLC TELEBALT COMPANY INN 3904050385 Kaliningrad region Manufacture of television receivers including video monitors and projectors |
-0,09 | |
|
359 Adequate |
| 999 | LLC SITRONICS Smart Technologies INN 7735512625 Moscow Manufacture of unrecorded magnetic and optical carriers |
0,31 | |
|
353 Adequate |
| 1000 | JSC ANGSTREM-T INN 7735128151 Moscow Manufacture of parts of electronic equipment Bankruptcy claim was filed in relation to company; results of proceeding should be expected |
-35,60 | |
|
400 Weak |
![]() — growth of the indicator to the previous period,
— growth of the indicator to the previous period, ![]() — decline of the indicator to the previous period .
— decline of the indicator to the previous period .
For ten years average amounts of net assets of TOP-1000 companies have increasing tendency (Picture 1).
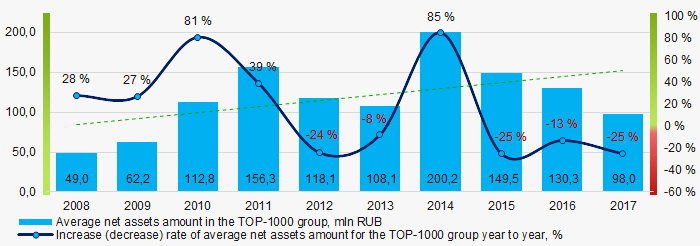 Picture 1. Change in TOP-1000 average indicators of the net assets amount of manufacturers of electronic products in 2008 – 2017
 Share of companies with insufficiency of property among TOP-1000 for the last three years tends to decrease (Picture 2).
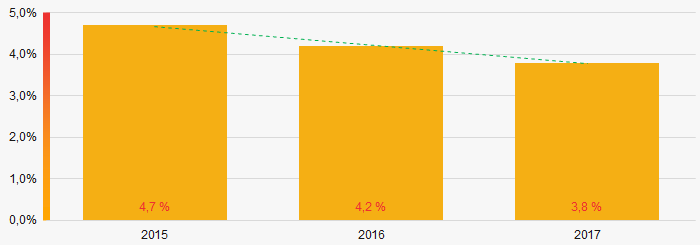 Picture 2. Share of companies with negative value of net assets amount in TOP-1000 in 2015 – 2017
 Sales revenue
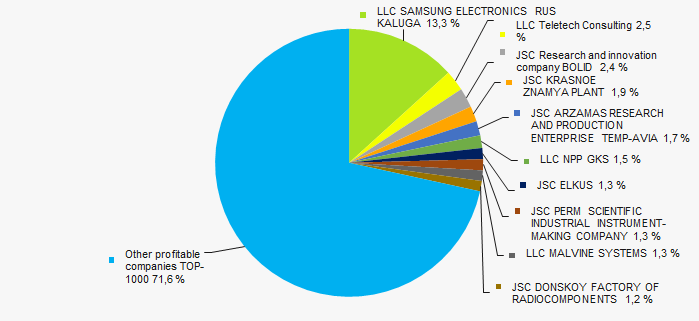
The revenue of 10 leaders of the industry made 31% of the total revenue of TOP-1000 companies in 2017. It demonstrates high level of competition (Picture 3).
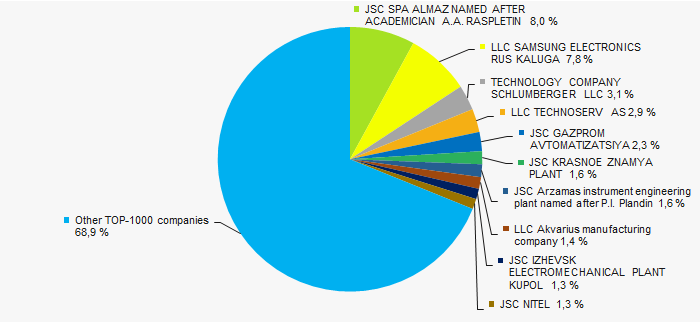 Picture 3. Shares of participation of TOP-10 companies in the total revenue of TOP-1000 companies for 2017
In general, an increase of indicators of average revenue volume is observed (Picture 4).
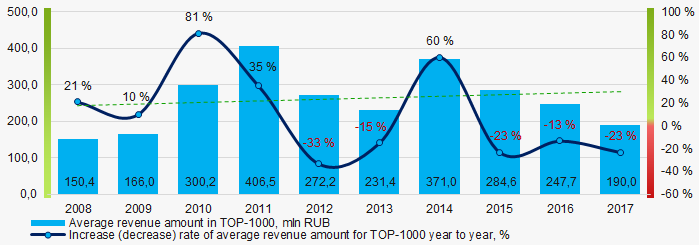 Picture 4. Change in the average revenue of TOP-1000 companies in 2008 – 2017
Profit and losses
The profit volume of 10 leading enterprises in 2017 made 28% of the total profit of TOP-1000 companies (Picture 5).
 Picture 5. Share of participation of TOP-10 companies in the total volume of profit of TOP-1000 companies for 2017
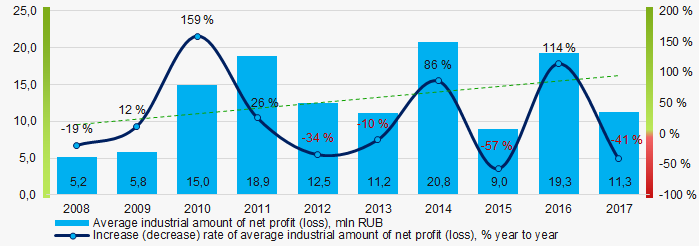 Picture 6.Change in the average indicators of net profit of TOP-1000 companies in 2008 – 2017
 Over the three-year period average values of net profit indicators of TOP-1000 companies have increasing tendency, besides, average amount of net loss is increasing (Picture 7).
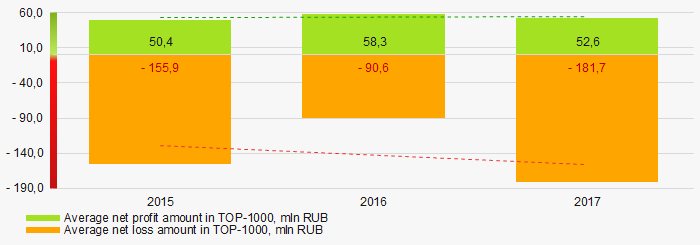 Picture 7. Change in the average indicators of profit and loss of TOP-1000 companies in 2015 – 2017
 Key financial ratios
Over the ten-year period the average indicators of the current liquidity ratio were above the range of recommended values – from 1,0 up to 2,0 with increasing tendency (Picture 8).
The current liquidity ratio (the relation of the amount of current assets to short-term liabilities) shows the sufficiency of company’s funds for repayment of its short-term liabilities.
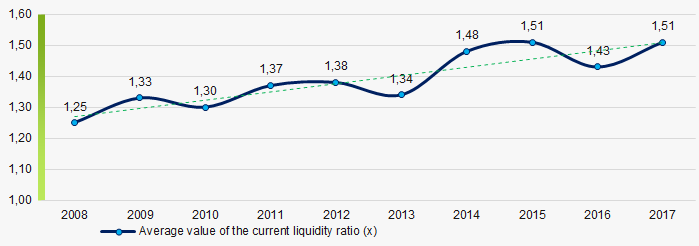 Picture 8. Change in the industry values of the current liquidity ratio of TOP-1000 companies in 2008 – 2017
 Increasing tendency in the indicators of the return on investments ratio has been observed for ten years. (Picture 9).
The ratio is calculated as the relation of net profit to the sum of own capital and long-term liabilities and demonstrates the return on the equity involved in the commercial activity of own capital and the long-term borrowed funds of an organization.
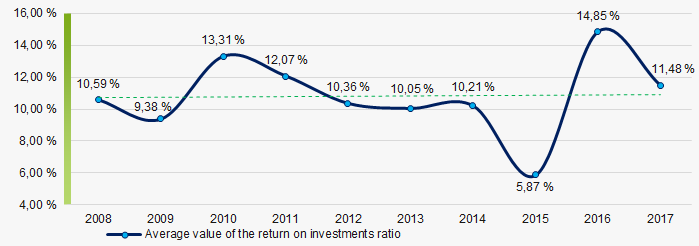 Picture 9. Change in the average values of the return on investments ratio of TOP-1000 companies in 2008 – 2017
 Asset turnover ratio is calculated as the relation of sales revenue to the average value of total assets for a period and characterizes the efficiency of use of all available resources, regardless of the sources of their attraction. The ratio shows how many times a year a complete cycle of production and circulation is made, yielding profit.
This business activity ratio showed a tendency to decrease for ten-year period (Picture 10).
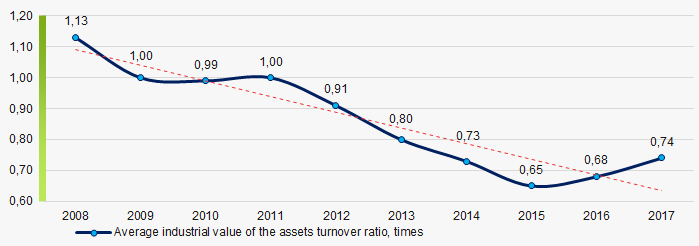 Picture 10. Change in the average values of the asset turnover ratio of TOP-1000 companies in 2008 – 2017
 Production structure
The largest share in the total revenue of TOP-1000 is owned by companies, specializing in manufacture of computers and peripheral equipment (Picture 11).
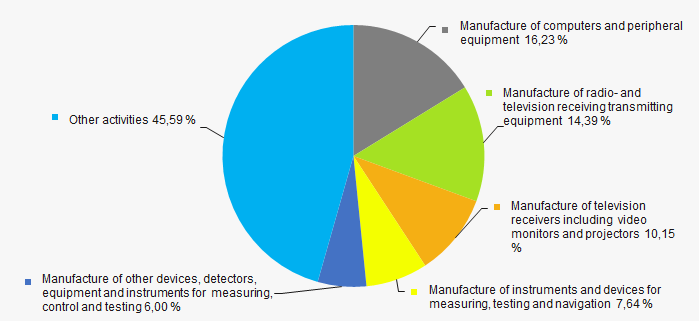 Picture 11. Distribution of companies by types of output in the total revenue of TOP-1000, %
76% of TOP-1000 companies are registered in the Register of small and medium enterprises of the Federal Tax Service of the RF. Besides, share of the companies in the total revenue of TOP-1000 amounts to 19% in 2017 (Picture 11).
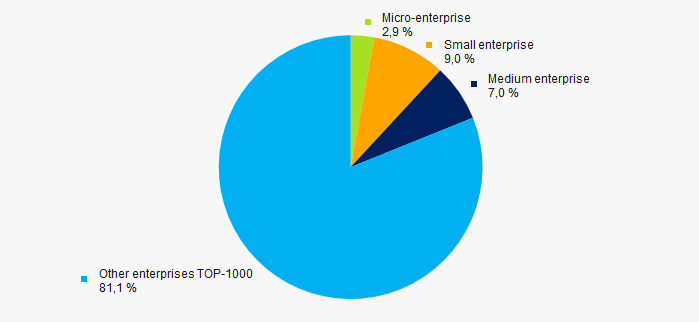 Picture 12. Shares of small and medium enterprises in TOP-1000 companies, %
Main regions of activities
TOP-1000 companies are unequally distributed on the territory of Russia and registered in 64 regions. The largest companies in terms of revenue volume are concentrated in Moscow and Saint-Petersburg (Picture 13).
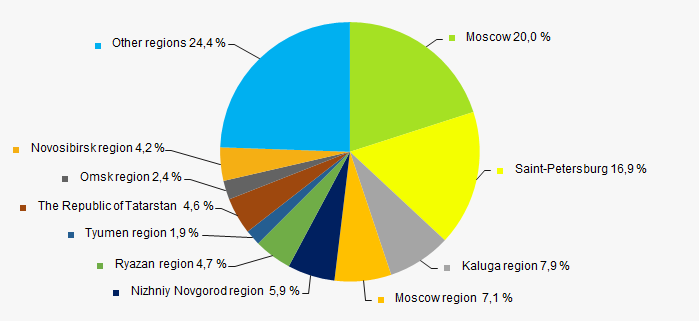 Picture 13. Distribution of revenue of TOP-1000 companies by regions of Russia
 Financial position score
An assessment of the financial position of TOP-1000 companies shows that more than half of companies are in an above the average financial position (Picture 14).
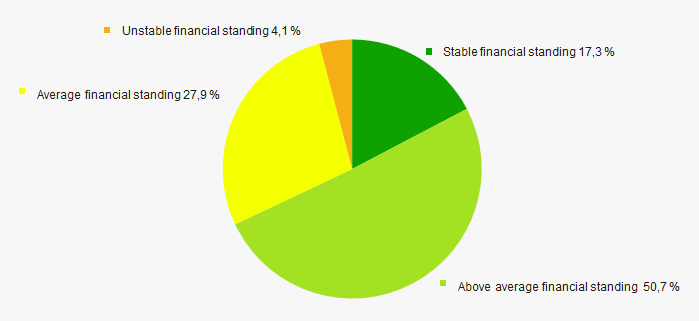 Picture 14. Distribution of TOP-1000 companies by financial position score
Solvency index Globas
Most of TOP-1000 companies have got from Medium to Superior Solvency index Globas, that points to their ability to repay their debts in time and fully (Picture 15).
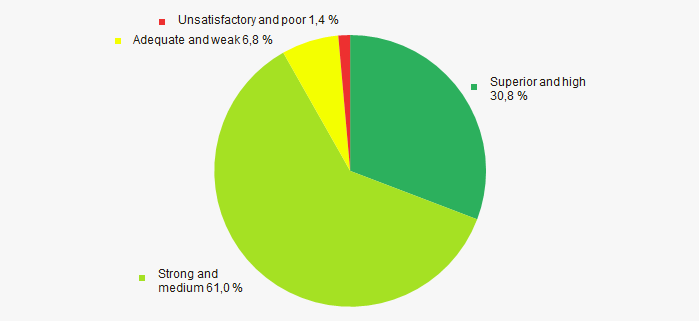 Picture 15. Distribution of TOP-1000 companies by solvency index Globas
Industrial production index
According to the data from the Federal State Statistics Service, during 12 months of 2017 – 2018 increasing tendency for the industrial production index of manufacture of computers, electronic and optical products is observed. For 9 months of 2018 the industrial production index has 2,3% increased at average, and in general, for the period from October 2017 to September 2018 increase made 3,2% at average (Picture 16).
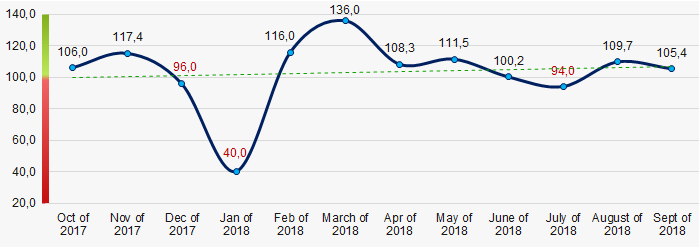 Picture 16. Industrial production index of manufacture of computers, electronic and optical products in 2017 – 2018, month to month (%)
Conclusion
Comprehensive assessment of the activity of largest companies of electronic industry, taking into account the main indexes, financial indicators and ratios, demonstrates the presence of favorable trends (Table 2).
| Trends and assessment factors | Share of factor, % |
| Rate of increase (decrease) of average amount of net assets | |
| Increase / decrease of share of companies with negative values of net assets | |
| Increase (decrease) rate of average revenue amount | |
| Rate of competition / monopolization | |
| Increase (decrease) rate of average net profit (loss) amount | |
| Increase / decrease of average net profit amount of TOP-1000 companies | |
| Increase / decrease of average net loss amount of TOP-1000 companies | |
| Increase / decrease of average industrial values of the current liquidity ratio | |
| Increase / decrease of average industrial values of the return on investments ratio | |
| Increase / decrease of average industrial values of the assets turnover ratio, times | |
| Share of small and medium enterprises in the industry in terms of revenue volume more than 30% | |
| Regional concentration | |
| Financial position (major share) | |
| Solvency index Globas (major share) | |
| Industrial production index | |
| Average value of factors | |
![]() — positive trend (factor),
— positive trend (factor), ![]() — negative trend (factor).
— negative trend (factor).