
Order a report
Custom-made industry research, company ratings, competitor analysis


Trends in the work of Irkutsk companies
Information agency Credinform represents an overview of activity trends of the largest companies in the real sector of the economy of Irkutsk region.
The enterprises with the largest volume of annual revenue of the real sector of the economy in Irkutsk region (TOP-1000) were selected for the analysis, according to the data from the Statistical Register for the latest available periods (for 2012-2017). The analysis was made on the basis of the data of the Information and Analytical system Globas.
Net assets is an indicator, reflecting the real value of the property of an enterprise. It is calculated annually as the difference between assets on the balance sheet of the enterprise and its debt obligations. The indicator of net assets is considered negative (insufficiency of property), if company’s debt exceeds the value of its property.
| №, Name, INN, type of activity | Net assets value, bln RUB | Solvency index Globas | ||||
| 2013 | 2014 | 2015 | 2016 | 2017 | ||
| 1 | 2 | 3 | 4 | 5 | 6 | 7 |
| 1 TRANSNEFT – VOSTOK LLC INN 3801079671 Oil transportation via pipelines |
|
|
|
|
|
199 High |
| 2 IRKUTSKAYA NEFTYANAYA KOMPANIYA LLC INN 3808066311 Extraction of crude oil |
|
|
|
|
|
166 Superior |
| 3 IRKUTSK JOINT STOCK COMPANY OF ENERGETICS AND ELECTRIFICATION INN 3800000220 Power generation |
|
|
|
|
|
160 Superior |
| 4 VERKHNECHONSKNEFTEGAZ NJSC INN 3808079367 Extraction of crude oil |
|
|
|
|
|
224 Strong |
| 5 IRKUTSK ELECTRONETWORK COMPANY PJSC INN 3812122706 Power transmission and technological connection to distribution grids |
|
|
|
|
|
274 Medium |
| 996 SIBEXPORTLES-TRADE LLC INN 3811100530 Wholesale of wood raw materials and raw timber Process of being wound up, 31.05.2018 |
|
|
|
|
|
600 Insufficient |
| 997 KRESTA LLC INN 3811021960 Construction of residential and non-residential buildings Process of being wound up, 12.10.2017 |
|
|
|
|
|
600 Insufficient |
| 998 BAIKAL SUBURBAN PASSENGER COMPANY NJSC INN 3808218300 Activity of railway transport: intercity and international passenger traffic |
|
|
|
|
|
244 Strong |
| 999 SAWING AND WOODWORKING ENTERPRISE IGIRMA NJSC INN 3811113307 Sawing and planing of wood Process of being wound up, 21.05.2018 |
|
|
|
|
|
600 Insufficient |
| 1000 TRANS-SIBERIAN FOREST COMPANY LTD INN 3808119644 Sawing and planing of wood Process of being wound up, 18.05.2018 |
|
|
|
|
|
600 Insufficient |
![]() — growth of the indicator to the previous period,
— growth of the indicator to the previous period, ![]() — decline of the indicator to the previous period.
— decline of the indicator to the previous period.
The average values of net assets of TOP-1000 enterprises tend to increase over the five-year period (Picture 1).
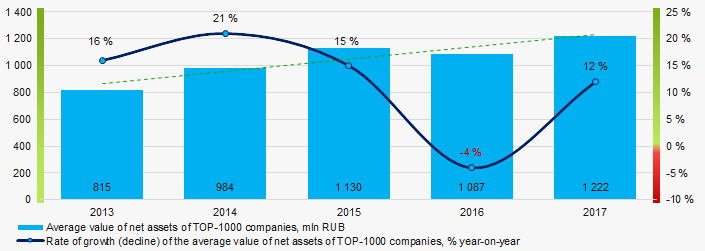 Picture 1. Change in the average indicators of the net asset value of TOP-1000 enterprises in 2013 – 2017
 The shares of TOP-1000 enterprises with insufficiency of assets have a tendency to increase in the last five years (Picture 2).
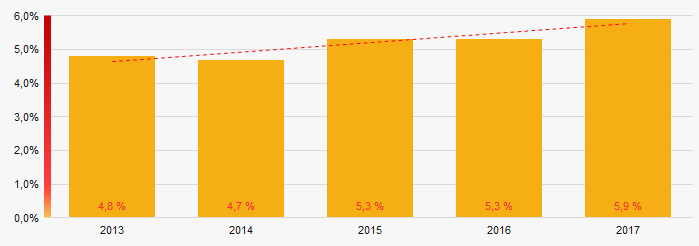 Picture 2. Shares of enterprises with negative values of net assets in TOP-1000
Sales revenue
The revenue volume of 10 leading companies of the region made 49% of the total revenue of TOP-1000 in 2017. (Picture 3). It points to a high level of concentration of production in the Irkutsk region.
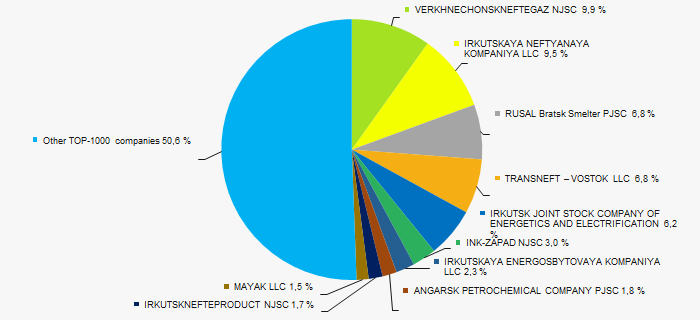 Picture 3. Shares of participation of TOP-10 companies in the total revenue of TOP-1000 enterprises for 2017
In general, there is a trend towards an increase in revenue volume (Picture 4).
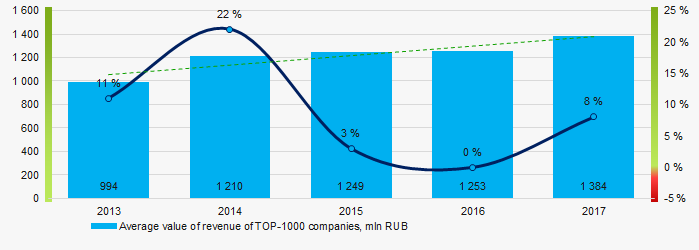 Picture 4. Change in the average revenue of TOP-100 enterprises in 2013 – 2017
Profit and losses
The net profit volume of 10 industry leaders of the region made 85% of the total profit of TOP-1000 companies in 2017 (Picture 5).
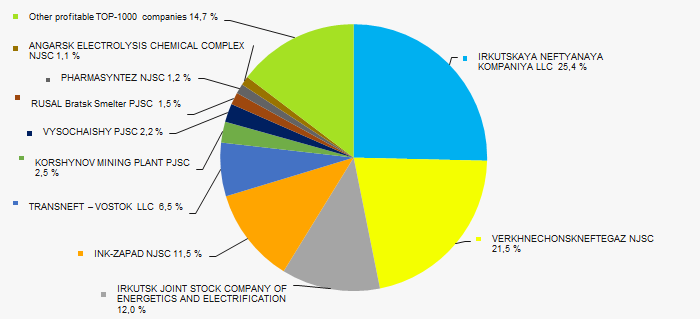 Picture 5. Shares of participation of TOP-10 companies in the total volume of profit of TOP-1000 enterprises for 2017
 In general, the average profit of TOP-1000 enterprises trends to increase over the five-year period (Picture 6).
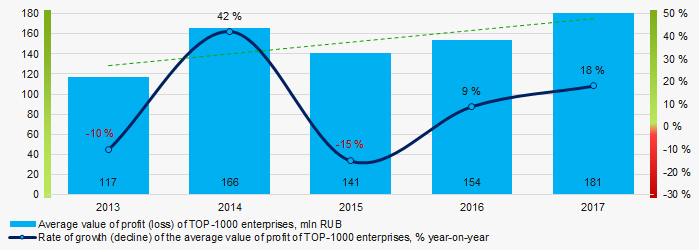 Picture 6. Change in the average values of net profit of TOP-1000 enterprises in 2013 – 2017
Average values of net profit’s indicators of TOP-1000 companies increase for the five-year period, at the same time the average value of net loss decreases. (Picture 7).
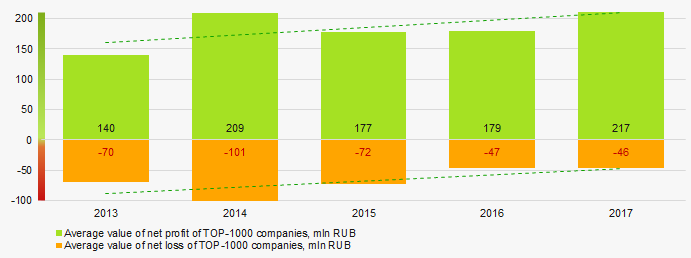 Picture 7. Change in the average values of indicators of net profit and net loss of TOP-1000 companies in 2013 – 2017
Key financial ratios
Over the five-year period the average indicators of the total liquidity ratio of TOP-1000 enterprises were above the range of recommended values - from 1,0 up to 2,0, with a tendency to increase (Picture 8).
The total liquidity ratio (the relation of the amount of current assets to short-term liabilities) shows the sufficiency of company’s funds for repayment of its short-term liabilities.
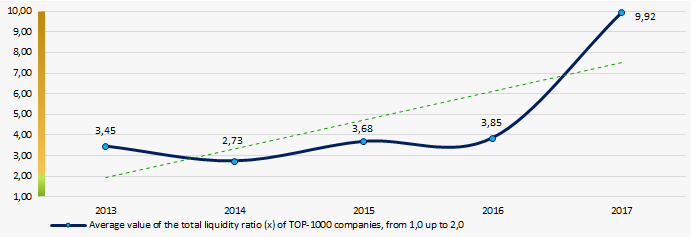 Picture 8. Change in the average values of the total liquidity ratio of TOP-1000 enterprises in 2013 – 2017
 There has been a high level of average values of the return on investment ratio for five years, with a tendency to decrease (Picture 9).
The ratio is calculated as the relation of net profit to the sum of own capital and long-term liabilities and demonstrates the return on the equity of own capital involved in the commercial activity and the long-term borrowed funds of an organization.
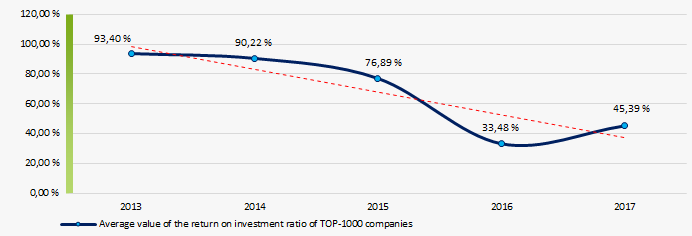 Picture 9. Change in the average values of the return on investment ratio of TOP-1000 enterprises in 2013 – 2017
Asset turnover ratio is calculated as the relation of sales proceeds to the average value of total assets for a period and characterizes the efficiency of use of all available resources, regardless of the sources of their attraction. The ratio shows how many times a year a complete cycle of production and circulation is made, yielding profit.
This ratio of business activity showed a tendency to decrease over the five-year period (Picture 10).
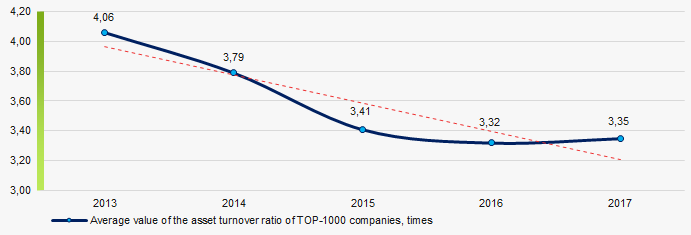 Picture 10. Change in the average values of the asset turnover ratio of TOP-1000 enterprises in 2013 – 2017
Production and service structure
The largest shares in the total revenue of TOP-1000 are owned by companies, specializing in the extraction of crude oil and natural gas, as well as wholesale companies (Picture 11).
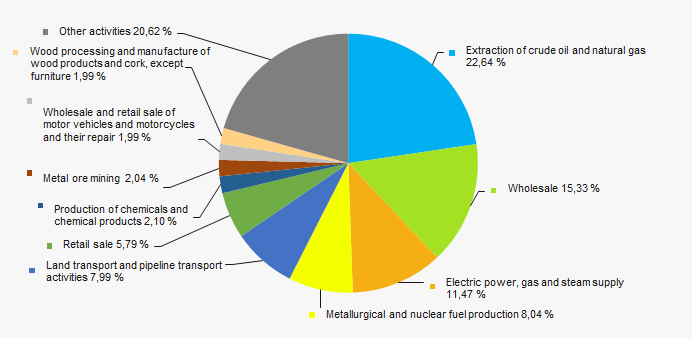 Picture 11. Distribution of types of activity in the total revenue of TOP-1000 companies
74% of TOP-1000 companies are registered in the Register of small and medium-sized businesses of the Federal Tax Service of the RF. At the same time, their share in the total revenue of TOP-1000 enterprises amounted to 15,3% (Picture 12).
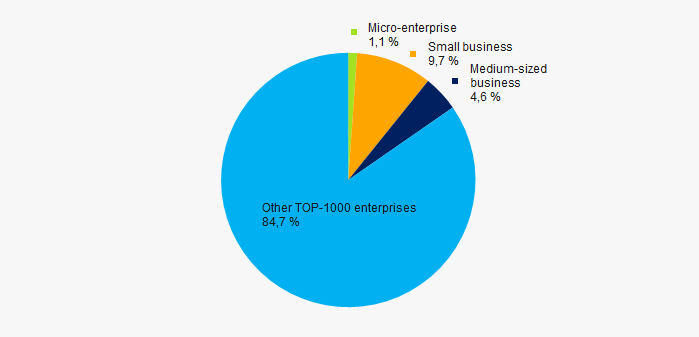 Picture 12. Shares of proceeds of small and medium-sized businesses in TOP-1000 companies
Main regions of activity
The TOP-1000 companies are distributed unequal across Irkutsk region and registered in 30 districts and inhabited localities. 80% of the largest enterprises in terms of revenue are concentrated in the regional center - in Irkutsk and in Bratsk region (Picture 13).
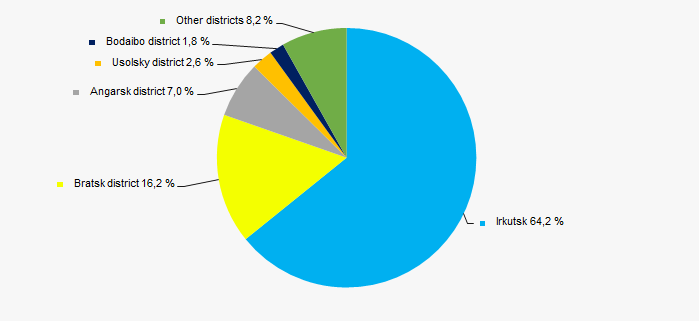 Picture 13. Distribution of the revenue of TOP-1000 companies by regions of Irkutsk region
Financial position score
An assessment of the financial position of TOP-1000 companies shows that more than half of them are in a stable financial position and above average (Picture 14).
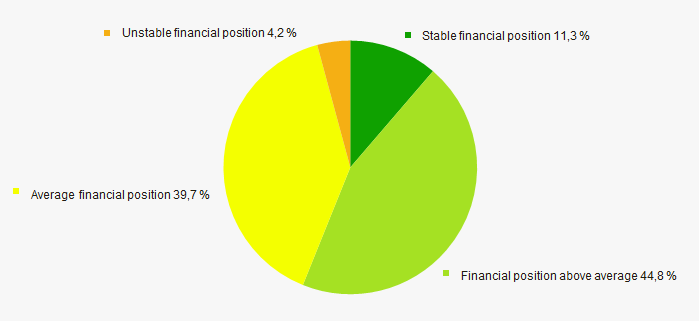 Picture 14. Distribution of TOP-1000 companies by financial position score
Solvency index Globas
Vast majority of TOP-1000 companies got Superior/High or Strong/Medium Solvency index Globas, that points to their ability to pay off their debts in time and fully (Picture 15).
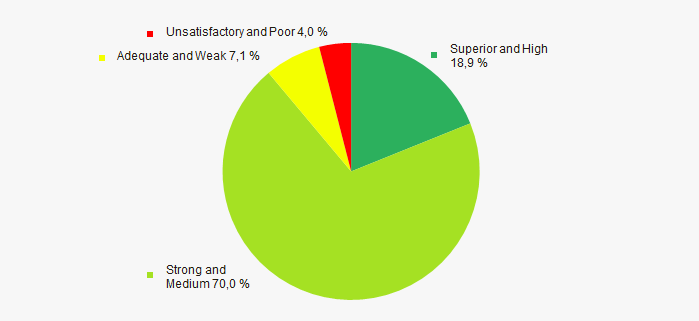 Picture 15. Distribution of TOP-1000 companies by solvency index Globas
Industrial production index
According to the Federal Service of State Statistics, there is a tendency towards an increase in indicators of the industrial production index in Irkutsk region during 12 months of 2018. (Picture 16).
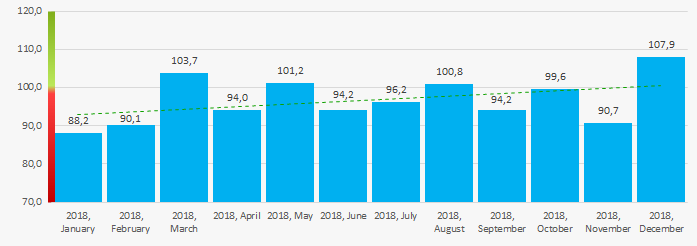 Picture 16. Industrial production index in Irkutsk region in 2017 – 2018, month to month (%)
According to the same information, the share of enterprises of Irkutsk region in the amount of revenue from the sale of goods, works, services made 1,03% countrywide for 9 months of 2018.
Conclusion
A comprehensive assessment of activity of the largest companies in the real sector of the economy of Irkutsk region, taking into account the main indices, financial indicators and ratios, points to the prevalence of positive trends (Table 2).
| Trends and evaluation factors of TOP-1000 enterprise | Specific share of factor, % |
| Rate of growth (decline) in the average size of net assets | |
| Increase / decrease in the share of enterprises with negative values of net assets | |
| Concentration level of capital | |
| Rate of growth (decline) in the average size of revenue | |
| Rate of growth (decline) in the average size of profit (loss) | |
| Growth / decline in average values of companies’ net profit | |
| Growth / decline in average values of companies’ net loss | |
| Increase / decrease in average values of total liquidity ratio | |
| Increase / decrease in average values of return on investment ratio | |
| Increase / decrease in average values of asset turnover ratio, times | |
| Share of small and medium-sized businesses in the region in terms of revenue being more than 22% | |
| Regional concentration | |
| Financial position (the largest share) | |
| Solvency index Globas (the largest share) | |
| Industrial production index | |
| Average value of the specific share of factors | |
![]() — positive trend (factor),
— positive trend (factor), ![]() — negative trend (factor).
— negative trend (factor).