Order a report
Custom-made industry research, company ratings, competitor analysis


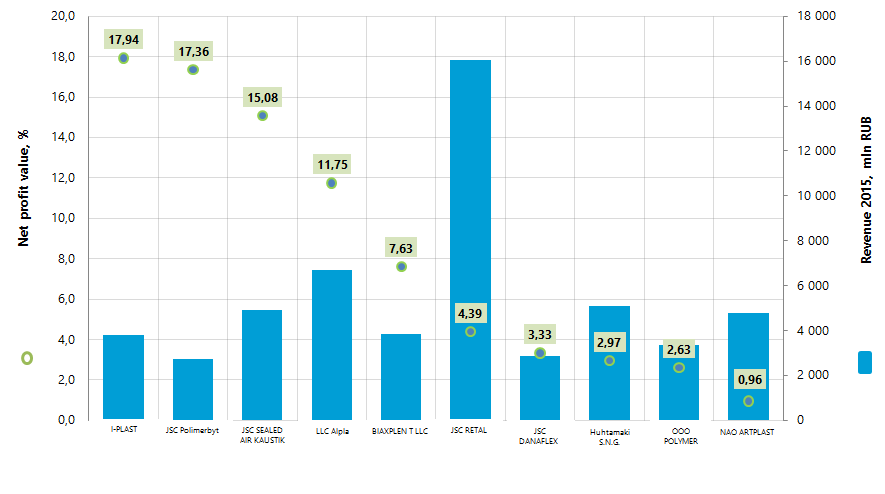
Net profit ratio of the largest plastic package manufacturers in Russia
Information agency Credinform has prepared the ranking of the largest plastic package manufacturers in Russia. Manufacturers of plastic package having the largest annual revenue in the industry (TOP-10) for the last available in the Statistical register period (2015 and 2014) were taken for the ranking. Further they were ranked on the net profit ratio (Table 1).
The net profit ratio (%) is calculated as a ratio of the net profit (loss) to sales revenue. The ratio shows the rate of companies’ sales profit. There aren’t any standard values of the indicator. It is recommended to compare companies belonging to one industry or the change of the ratio with time by a certain enterprise. The negative value of the indicator shows that there is a net loss. The more the value of indicator is, the more effective the enterprise works.
In order to get the full and fair picture of the company’s financial situation, it is necessary to pay attention not only to compatibility with standard values, but also to all the available complex of financial indicators and ratios.
| Name | Net profit 2015, mln RUB | Revenue 2015, mln RUB | Revenue 2015 to 2014, +/- % | Net profit ratio 2014, % | Net profit ratio 2015, % | Solvency index Globas-i® |
|---|---|---|---|---|---|---|
| I-PLAST INN 1651057721 Republic of Tatarstan |
679,6 | 3 787,8 | 19 | 16,21 | 17,94 | 210 High |
| JSC Polimerbyt INN 7721035813 Moscow |
476,1 | 2 743,4 | 18 | 19,69 | 17,36 | 227 High |
| JSC SEALED AIR KAUSTIK INN 3448003994 Volgograd region |
741,4 | 4 915,2 | 26 | 11,92 | 15,08 | 153 Prime |
| LLC Alpla INN 5056000026 Moscow region |
786,8 | 6 694,7 | 33 | 5,29 | 11,75 | 170 Prime |
| BIAXPLEN T LLC INN 7017296800 Tomsk region |
293,8 | 3 849,3 | 84 | -0,19 | 7,63 | 286 High |
| JSC RETAL INN 7704521059 Moscow region |
705,4 | 16 072,9 | 17 | 1,96 | 4,39 | 210 High |
| JSC DANAFLEX INN 1622003425 Republic of Tatarstan |
96,1 | 2 885,3 | 26 | 0,41 | 3,33 | 235 High |
| Huhtamaki S.N.G. INN 7724000760 Moscow region |
150,6 | 5 074,4 | 21 | 1,35 | 2,97 | 218 High |
| OOO POLYMER INN 6724001017 Smolensk region |
88,7 | 3 368,8 | 59 | 0,00 | 2,63 | 229 High |
| NAO ARTPLAST INN 5037050871 Moscow |
45,9 | 4 784,6 | 14 | 0,22 | 0,96 | 219 High |
| Total for TOP-10 group of companies | 4 064,4 | 54 176,4 | 26* | 5,69* | 8,40* | |
| Total for TOP-100 group of companies | 4 868,8 | 141 490,5 | 30* | -0,71** | 1,73** |
*) - group of companies average value
**) - industry average value
The average value of net profit ratio in the group of companies TOP-10 in 2015 is notably higher than industry-average value. At the same time the indicator value of nine companies of the TOP-10 in 2015 increased comparing to the previous period. Indicator value of JSC Polimerbyt decreased by 2,33%.
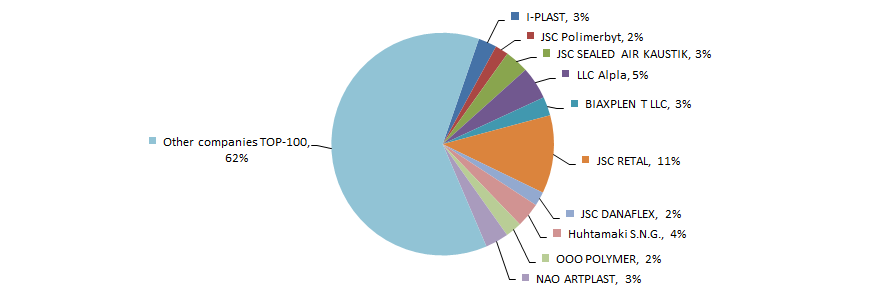
The revenue volume of the 10 largest companies amounts to 38% of the total revenue of 100 largest companies. It gives evidence to low monopolization rate and high competition in this industry. For example, the share of the company largest by the revenue volume in 2015 – JSC RETAL – amounted to 11% in the total revenue of the TOP-100 group of companies (Figure 2).
All of the TOP-10 companies were given prime or high solvency index Globas-i®, which bears evidence to their ability to meet debt obligations timely and full. All TOP-10 companies in 2015 increased their net profit and revenue comparing to the previous period.
The indicators of plastic package manufacture by volume over the 2010 to 2016 period aren’t stable, which is confirmed by the data of the Federal State Statistics Service (Rosstat) (Table 2).
| Types of products | 2011 | 2012 | 2013 | 2014 | 2015 | 2016 |
|---|---|---|---|---|---|---|
| Bottles, flasks and similar items made from polymer | 3,4 | 26,1 | 11,7 | 2,5 | 4,9 | 15,1 |
| Other polymer packaging items | 50,6 | 14,7 | 5,5 | -2,9 | 2,8 | 6,5 |
| Sacks and bags made from polymer | 6,7 | 43,8 | 25,5 | -3,4 | 2,3 | 20,6 |
| Polyvinylchloride and polystyrene films | 15,3 | 1,7 | 3,0 | 231,4 | -43,2 | -46,1 |
| Polymer reservoirs, tankers, containers and similar tanks with a capacity of more than 300 l | 46,9 | 1,4 | 757,5 | -47,1 | -7,6 | -86,3 |
| Average value over all types of products | 24,6 | 17,5 | 160,6 | 36,1 | -8,2 | -18,0 |
*) In the Table 2 the decline in production is highlighted with the red shading, the growth - with the green one. Color density depends on indicator value.
Manufacture of polymer bottles appeared to be the most stable over the 2010 to 2016 period.
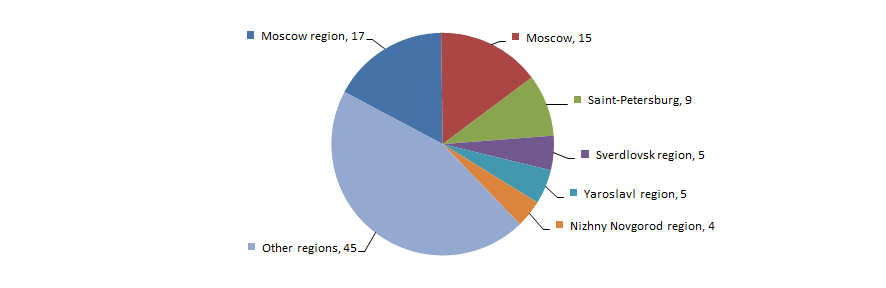
Enterprises manufacturing plastic package are distributed in an uneven manner within country’s regions and gravitate to the developed industrial centers, having the infrastructure for high-tech manufacture. It is confirmed by the data of the Information and Analytical system Globas-i, according to which 100 companies industry-largest by the revenue volume for 2015 are registered in 33 regions of Russia (Figure 3).