
Order a report
Custom-made industry research, company ratings, competitor analysis


Economy in Chelyabinsk in crisis years
Information agency Credinform has prepared a review of the activity trends of the largest companies of real economy in Chelyabinsk during the financial crisis of 2008 – 2009 years.
The largest enterprises (TOP-1000) in terms of annual revenue were selected for the analysis according to the data from the Statistical Register for the period of 2006 – 2011 years. The analysis was based on the data from the Information and Analytical system Globas.
The number of active companies From 2006 to 2011, the number of active companies increased, but the growth rates decreased especially during the acute phase of the crisis and the period of recovery.
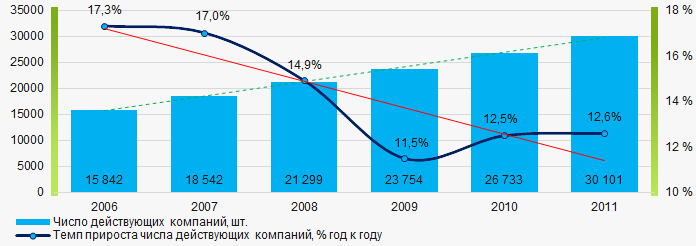 Picture 1. Change in the number of active companies in 2006 – 2011
Net assets are total assets less total liabilities. This indicator reflects the real value of the property of an enterprise. When the company’s debt exceeds the value of its property, the indicator is considered negative (insufficiency of property).
The largest company of the real sector of economy in Chelyabinsk in term of net assets was JSC CHELYABINSK PIPE PLANT, INN 7449006730. In 2011, net assets value of the company amounted to 18,9 billion RUB, in 2019 - to 18,8 billion RUB.
The lowest net assets value among TOP-1000 was recorded for CHELYABINSK TRAKTOR PLANT-URALTRAC LIMITED, INN 7452027843. In 2011, insufficiency of property of the company was indicated in negative value of -616 million RUB, and in 2019 the figure amounted to -12,3 billion RUB in 2018.
In 2006 - 2011, the average net assets values of TOP-1000 had a trend to increase, however, the growth rates were decreasing especially during the acute phase of the crisis (Picture 2).
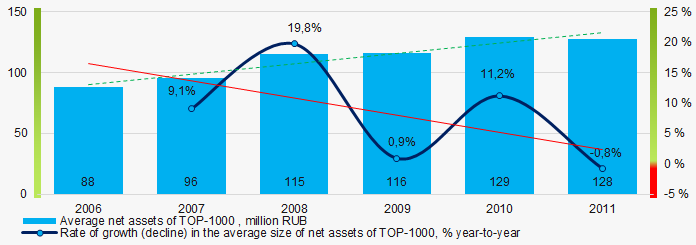 Picture 2. Change in average net assets value in TOP-1000 in 2006 – 2011
In general, the shares of TOP-1000 companies with insufficient property had a trend to increase in 2006-2011(Picture 3).
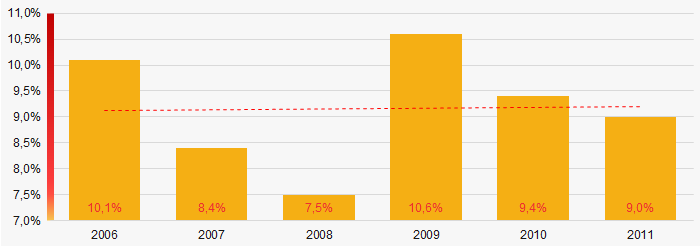 Picture 3. Shares of companies with negative net assets value in TOP-1000 in 2006 – 2011
Sales revenue
The largest company of the real sector of economy in Chelyabinsk by revenue was CHELYABINSK METALLURGICAL PLANT JSC, INN 7450001007. The revenue volume amounted to 99,2 billion RUB in 2011, and rolled over to 113 billion RUB in 2019.
In general, there was a trend to increase in revenue with increasing growth rate (Picture 4).
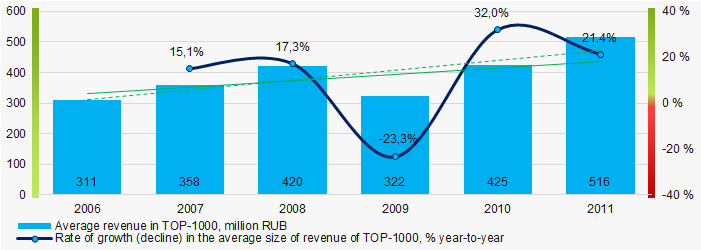 Picture 4. Change in average revenue in TOP-1000 in 2006 – 2011
Profit and loss
The largest company of the real sector of economy in Chelyabinsk in term of net profit was JOINT STOCK COMPANY TRUBODETAL, INN 7451047011. The company’s profit amounted to 2,8 billion RUB in 2011, and the loss was registered amounting to -822 million RUB in 2019.
During the period of 2006 – 2011, the average profit figures of TOP-1000 companies had a trend to decrease (Picture 5).
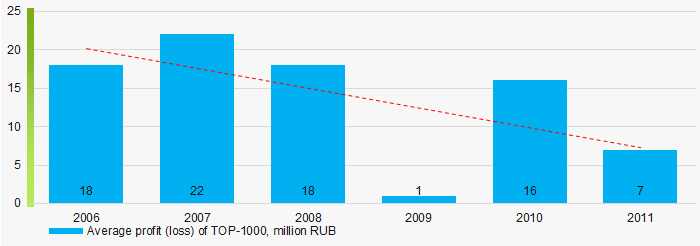 Picture 5. Change in average profit (loss) in TOP-1000 in 2006- 2011
In 2006 – 2011, the average net profit figures of TOP-1000 companies had a trend to decrease with the increasing average net loss (Picture 6).
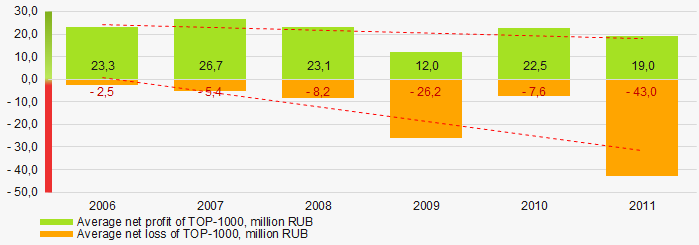 Picture 6. Change in average net profit and net loss in ТОP-1000 in 2006 – 2011
Key financial ratios
In 2006 – 2011, the average values of the current liquidity ratio of TOP-1000 were above the recommended one – from 1,0 to 2,0, with a trend to increase. (Picture 7).
Current liquidity ratio (current assets to short-term liabilities) shows the sufficiency of company’s assets to repay on short-term liabilities.
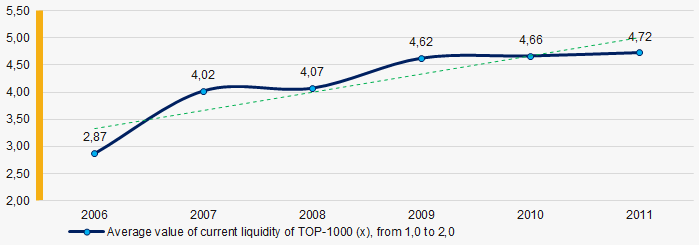 Picture 7. Change in average values of current liquidity ratio in TOP-1000 in 2006 – 2011
At the period of 2006 – 2011, there was a general trend to decrease in the average ROI values (Picture 8).
ROI ratio is calculated as net profit to sum of shareholders equity and long-term liabilities, and shows the return of equity involved in commercial activities and long-term borrowed funds.
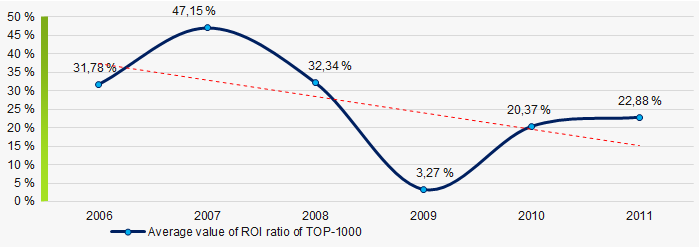 Picture 8. Change in average values of ROI ratio in TOP-1000 in 2006 – 2011
Assets turnover ratio is the ratio of sales revenue and company’s average total assets for a period. It characterizes the effectiveness of using of all available resources, regardless the source of their attraction. The ratio shows how many times per year the full cycle of production and circulation is performed, generating the corresponding effect in the form of profit.
In 2006 – 2011, there was a trend to decrease of this ratio, especially during the acute phase of the crisis and the period of recovery. (Picture 9).
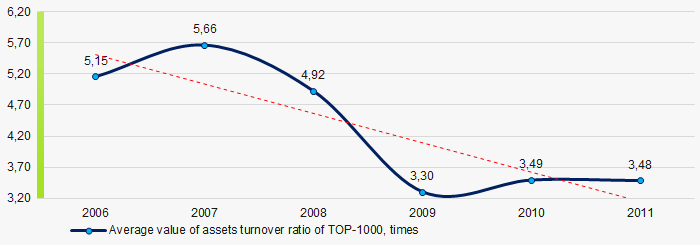 Picture 9. Change in average values of assets turnover ratio in TOP-1000 in 2006 – 2011
Small enterprises
80% companies of TOP-1000 are registered in the Register of small and medium-sized enterprises of the Federal Tax Service of the Russian Federation. However, their share in total revenue of TOP-1000 amounted 15% in 2011 (Picture 10).
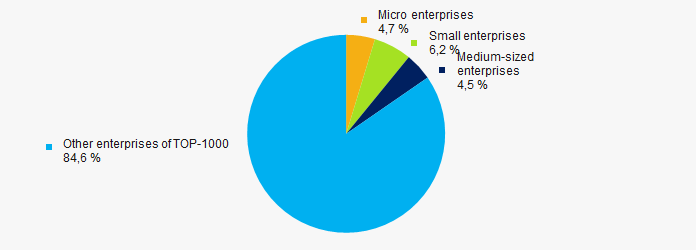 Picture 10. Shares of small and medium-sized enterprises in TOP-1000 in 2011
Financial position score
According to the assessment, the financial position of most of TOP-1000 companies is average in 2020 (Picture 11).
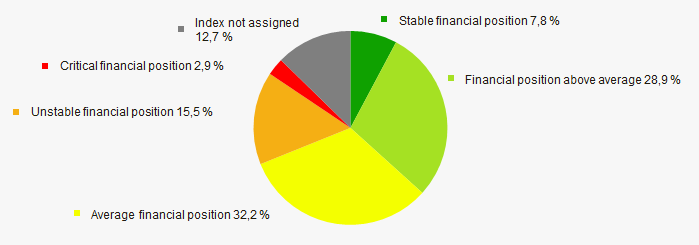 Picture 11. Distribution of TOP-1000 companies by financial position score in 2020
Solvency index Globas
In 2020, most of TOP-1000 companies got Superior / High and Strong / Medium index Globas. This fact shows their ability to meet their obligations fully and by the due date (Picture 12).
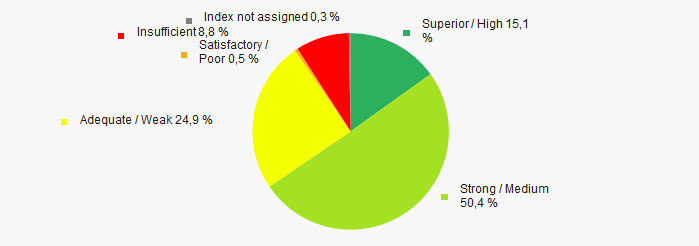 Picture 12. Distribution of TOP-1000 companies by solvency index Globas
Conclusion
Complex assessment of activity of the largest companies of the real economy sector of Chelyabinsk, taking into account the main indexes, financial ratios and indicators, demonstrates the prevalence of negative trends in 2006 - 2011 (Table 1).
| Trends and evaluation factors | Relative share of factor, % | Possible forecast |
| Dynamics of the number of active companies | |
|
| Rate of growth of the number of active companies | |
During the acute phase of the crisis and the period of recovery, rate of growth of the number of active companies may be decreased |
| Dynamics of the average net assets value | |
|
| Rate of growth (decline) in the average size of net assets | |
During the acute phase of the crisis and the period of recovery, rate of growth in the net assets may be decreased |
| Increase / decrease in the share of enterprises with negative values of net assets | |
During the beginning of the crisis, the share of companies with negative values of net assets may be increased |
| Dynamics of the average revenue | |
|
| Rate of growth (decline) in the average size of revenue | |
During the acute phase of the crisis, rate of growth in revenue may be decreased |
| Dynamics of the average profit | |
During the acute phase of the crisis and the period of recovery, rate of growth in average profit may be decreased |
| Growth / decline in average values of companies’ net loss | |
During the acute phase of the crisis and the period of recovery, net profit may be increased |
| Growth / decline in average values of companies’ net loss | |
During the acute phase of the crisis and the period of recovery, net loss may be increased |
| Increase / decrease in average values of current liquidity ratio | |
|
| Increase / decrease in average values of return on investment ratio | |
During the acute phase of the crisis and the period of recovery, return on investment ratio may by decreased |
| Increase / decrease in average values of asset turnover ratio, times | |
During the acute phase of the crisis and the period of recovery, business activity may by decreased |
| Share of small and medium-sized businesses in terms of revenue being more than 20% | |
|
| Financial position (the largest share) | |
|
| Solvency index Globas (the largest share) | |
|
| Average value of relative share of factors | |
![]() positive trend (factor),
positive trend (factor), ![]() negative trend (factor).
negative trend (factor).