Аgro industrial enterprises of the North Caucasian Federal District of Russia
Information agency Credinform has observed trends in the activity of the largest enterprises of the NCFD of Russia.
Enterprises with the largest volume of annual revenue (TOP-1000) were selected for the analysis, according to the data from the Statistical Register for the latest available periods (for 2013-2018). The analysis was made on the basis of the data of the Information and Analytical system Globas.
Net assets is an indicator, reflecting the real value of company's property, is calculated annually as the difference between assets on the enterprise balance and its debt obligations. The indicator of net assets is considered negative (insufficiency of property), if company’s debt exceeds the value of its property.
The largest company in the NCFD in terms of net assets amount is LLC STAVROPOLSKIY BROILER, INN 2623030222, Stavropol territory. In 2018 net assets of the enterprise amounted to 9,4 billion RUB.
LLC ANDROPOVSK AGROPROJECT, INN 2603010073, Stavropol territory, had the smallest amount of net assets in the TOP-1000 group. Insufficiency of property of the company in 2018 was expressed in negative value -339 million RUB.
For a five-year period average amount of net assets of TOP-1000 companies has increasing tendency (Picture 1).
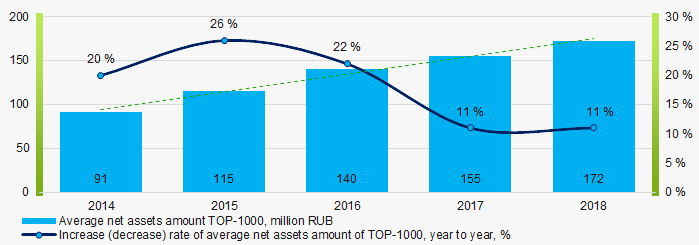 Picture 1. Change in average indicators of the net asset amount of TOP-1000 companies in 2014 – 2018
Share of companies with insufficiency of property in the TOP-1000 has increasing tendency for the last five years (Picture 2).
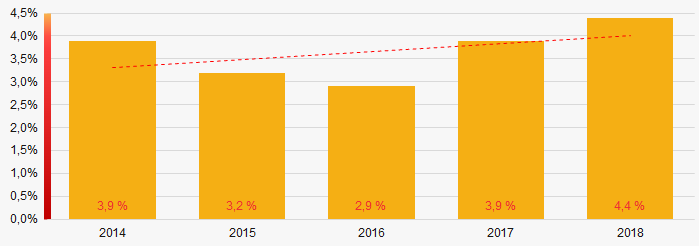 Picture 2. Shares of companies with negative values of net assets in TOP-1000 companies
Sales revenue
The revenue volume of 10 leaders of the industry made almost 32% of the total revenue of TOP-1000 companies in 2018 (Picture 3). It demonstrates relatively high level of competition in the industry in the NCFD.
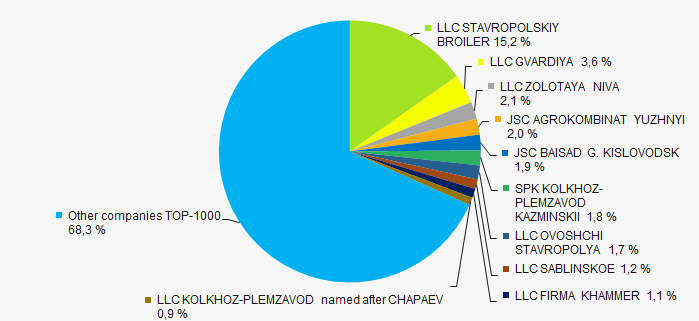 Picture 3. Shares of participation of TOP-10 companies in the total revenue of TOP-1000 companies for 2018
In general, an increasing tendency in revenue volume is observed (Picture 4).
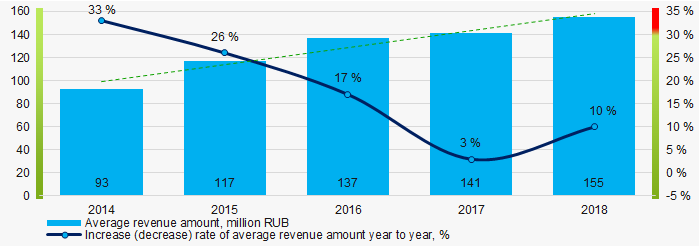 Picture 4. Change in the average revenue of top-1000 enterprises in 2014 – 2018
Profit and losses
The largest company in terms of net profit amount is LLC GVARDIYA, INN 2611007356, Stavropol territory. Following the results of 2018, the profit amounted to 2 billion RUB.
In general, for the last five years average indicators of net profit for TOP-1000 group have an increasing tendency (Picture 5).
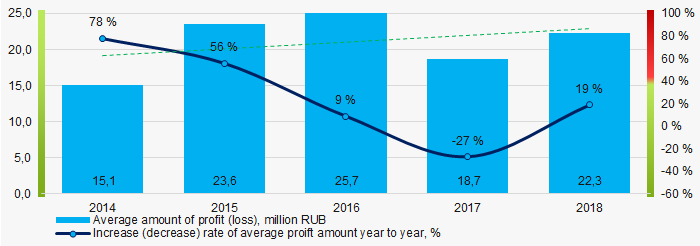 Picture 5. Change in the average indicators of net profit of TOP-1000 companies in 2014 – 2018
Over a five-year period, the average values of net profit indicators of TOP-1000 companies tend to increase. Besides, the average value of net loss increases (Picture 6).
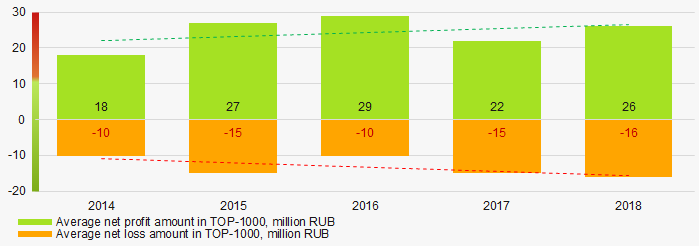 Picture 6. Change in the average indicators of net profit and loss of TOP-1000 companies in 2014 – 2018
Key financial ratios
Over the five-year period the average indicators of the current liquidity ratio of TOP-1000 in general were within the range of recommended values – from 1,0 up to 2,0 with decreasing tendency (Picture 7).
The current liquidity ratio (the relation of the amount of current assets to short-term liabilities) shows the sufficiency of company’s funds for repayment of its short-term liabilities.
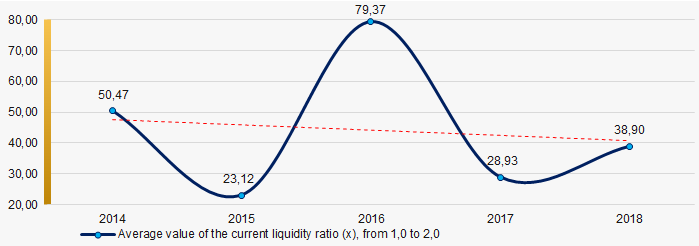 Picture 7. Change in the average values of the current liquidity ratio of TOP-1000 companies in 2014 – 2018
High level of the average values of the indicators of the return on investment ratio with increasing tendency have been observed for five years (Picture 8).
The ratio is calculated as the relation of net profit to the sum of own capital and long-term liabilities and demonstrates the return on the equity involved in the commercial activity of own capital and the long-term borrowed funds of an organization.
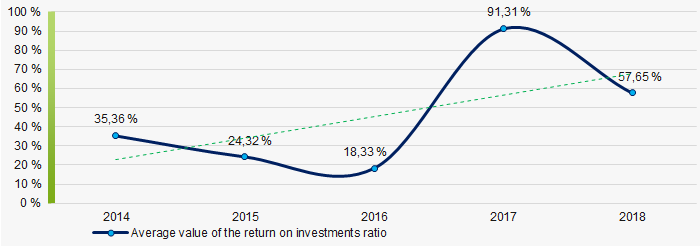 Picture 8. Change in the average values of the return on investment ratio of TOP-1000 companies in 2014 – 2018
Asset turnover ratio is calculated as the relation of sales revenue to the average value of total assets for a period and characterizes the efficiency of use of all available resources, regardless of the sources of their attraction. The ratio shows how many times a year a complete cycle of production and circulation is made, yielding profit.
This business activity ratio showed a tendency to increase for a five-year period (Picture 9).
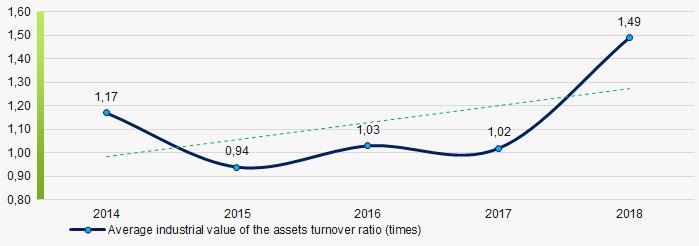 Picture 9. Change in the average values of the assets turnover ratio of TOP-1000 companies in 2014 – 2018
Small business
69% of the TOP-1000 companies are registered in the Register of small and medium enterprises of the Federal Tax Service of Russia. Besides, share of revenue in the total volume is more than 43%, that is almost twice higher than the average indicator countrywide (Picture 10).
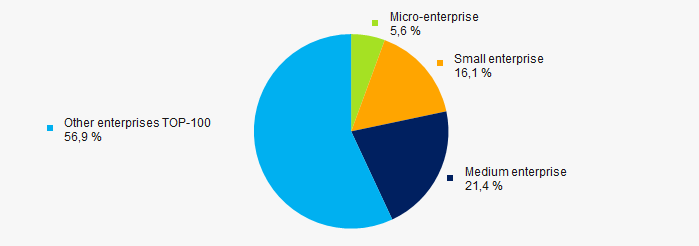 Picture 10. Shares of small and medium enterprises in TOP-1000 companies
Main regions of activity
TOP-1000 enterprises that registered in 7 regions of the federal district and are unequally distributed along the territory. Almost 86% are located in Stavropol territory (Picture 11).
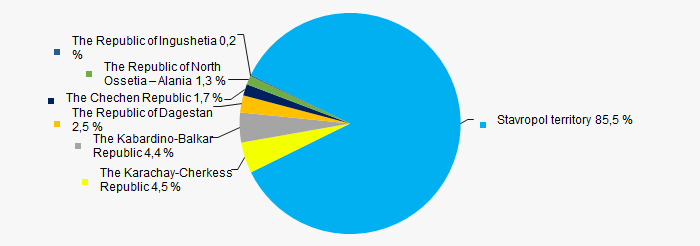 Picture 11. Distribution of revenue TOP-1000 companies by regions of the NCFD
Financial position score
An assessment of the financial position of TOP-1000 companies shows that the largest number is in an average financial position. (Picture 12).
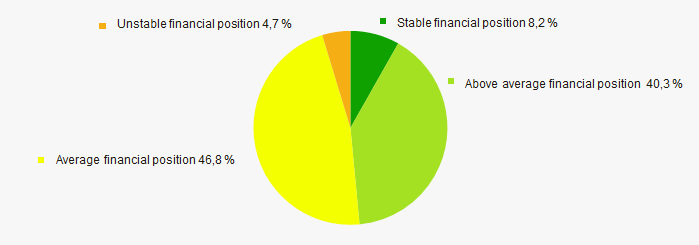 Picture 12. Distribution of TOP-1000 companies by financial position score
Solvency index Globas
Most of TOP-1000 companies have got from Medium to Superior Solvency index Globas, that points to their ability to repay their debts in time and fully (Picture 13).
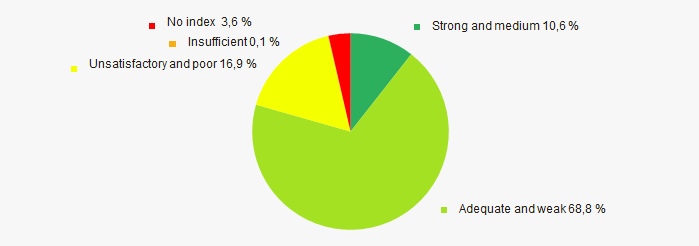 Picture 13. Distribution of TOP-1000 companies by solvency index Globas
Conclusion
Comprehensive assessment of the activity of the largest enterprises of the NCFD of Russia, taking into account the main indexes, financial indicators and ratios, demonstrates the presence of favorable trends (Table 1).
| Trends and assessment factors | Share of factor, % |
| Rate of increase (decrease) of average amount of net assets |  10 10 |
| Increase / decrease of share of companies with negative values of net assets |  -10 -10 |
| Level of competition/monopolization |  10 10 |
| Increase (decrease) rate of average revenue amount |  10 10 |
| Increase (decrease) rate of average net profit (loss) amount |  10 10 |
| Increase / decrease of average net profit amount of TOP-1000 companies |  10 10 |
| Increase / decrease of average net loss amount of TOP-1000 companies |  -10 -10 |
| Increase / decrease of average industrial values of the current liquidity ratio |  -10 -10 |
| Increase / decrease of average industrial values of the return on investments ratio |  10 10 |
| Increase / decrease of average industrial values of the assets turnover ratio, times |  10 10 |
| Share of small and medium enterprises in the industry in terms of revenue volume more than 22% |  10 10 |
| Regional concentration |  -10 -10 |
| Financial position (major share) |  10 10 |
| Solvency index Globas (major share) |  10 10 |
| Average value of factors |  3,9 3,9 |
 positive trend (factor),
  negative trend (factor).
TOP-5 global multi-gaming eSports organizations by earnings for 2018
Information agency Credinform represents a ranking of global multi-gaming eSports organizations in term of earnings for 2018.
The first part of research was dedicated to TOP-5 multi-gamins organizations of the CIS. The Credinform experts analyzed the size and audience of eSports market, primary source of revenue, and presented the most popular computer games.
The second part includes analysis of the prize pool won by top teams of the word at the international championships, and their positions in global ratings. TOP-5 of eSports organizations was compiled with Orbis database by Bureau van Dijk.
The revenues of global eSports organizations are significantly different from those of the CIS. The main reason for the low income in the CIS is the lack of large sponsorship contracts. Investors examine carefully this segment, as eSports has recently become a commercially viable and effective business project. In Russia, investors prefer more traditional methods to accumulate capital - oil, gas, precious metals, stones or securities. However, this trend is gradually starting to change. With the development of technology, the growth of the audience and popularization of eSports, there is a smooth inflow of private investments. Today, Russian mobile operators invest their own funds in the development of computer sports, and become general partners. Nevertheless, global foreign organizations are pioneers in the eSports market, and they own most of this segment, hence the significant difference in income.
Today, the news that Nike, Adidas, Kappa or Microsoft have become the main partners of various global multi-gaming organizations is less surprising than 5 years ago.
| Rank | Team | 2018 revenue, million RUB | Prize pool of all time, million RUB | Position in CS: GO global ranking |
Position in Dota 2 global ranking  |
| 1 | Team Liquid (Netherlands) |
1 531,2 | 2 170,9 | 4 | 9 |
| 2 | Fnatic (London) |
1 020,8 | 920,5 | 3 | 8 |
| 3 | Evil Geniuses (USA) |
544,0 | 1 485,5 | 1 | 3 |
| 4 | Astralis (Denmark) |
352,6 | 477,1 | 2 | No Dota 2 team |
| 5 | Ninjas in Pyjamas (Sweden) |
163,8 | 263,8 | 12 | 21 |
| Outside the ranking | |||||
Cloud9 (USA) |
1 850,2 | 590,7 | 37 | Did not participate in the tournament for the last 3 months | |
Source: Orbis database by Bureau van Dijk; data from the Internet sources Forbes, HLTV, esportsearnings, and CQ. Revenue and prize pool converted to rubles at the dollar exchange rate on November 19, 2019.
The first place of the ranking is taken by Team Liquid (1531,2 million RUB). Team Liquid is an internationally renowned professional multi-gaming organization founded in 2000 in the Netherlands. It is one of the most successful eSports organizations in the world. The team unites over 60 cybersportsmen who have become champions in 14 types of computer games. The amount of prize pool won exceeds 2,17 million RUB, that makes the team the global leader. At various tournaments, the organization is a representative of the North American region, since the Americans play in the most teams. It has a sponsorship agreement with the American company Marvel Studios. In November 2019, Team Liquid became the second in the nomination “The Best eSports Organization of the Year” according to the Esports Awards 2019.
The organization’s Counter-Strike team is the 4th in the world. Until recently, the team was on top, but failed at the World Championships in Berlin, and were overtook in the rating. As for CS: GO, the team have never been the world champions. Having won a great number of international tournaments, Team Liquid have never managed to be on the winning side at the most important CS tournament, and left tournaments in the early stages.
Things go much better with Dota 2. The team won The International 2017 with a prize pool of 1,5 billion RUB, and were the second in 2019. For the three-year experience of The International, Team Liquid earned 1,2 billion RUB. However, Dota 2 team considered their results as unsatisfactory and decided to leave the organization. Therefore, Team Liquid was only the 9th in the global ranking.
In terms of income, Fnatic ranks the 2nd (1020,8 million RUB). Based in London, the organization is active since 2004. Fnatic is one of the most popular and titled organizations in the world. Their prize pool won exceeds 920 million RUB. As Team Liquid, Fnatic teams consist of gamers from different regions in the championships. The CS: GO team is comprised only of Swedish gamers, and Dota 2 team consists of representatives from Southeast Asia. In early November 2019, the organization announced a partnership with the Japanese brand Hello Kitty . Thanks to the collaboration, the Fnatic brand will become popular and in demand in Japan, and will bring organization millions of profits.
Fnatic's Counter-Strike team has won all possible prizes. It became a 3-time winner of the World Cup and other serious tournaments. For a long time the team was unequaled, but with the growth of the eSports market, the competition became tougher, and the team climbed down. Until recently, CS team experienced serious gaming problems and closed the world ranking, but substitutions helped to get the 3rd position back.
The organization has never won The International Dota 2. Semifinal in 2016 was the best result in the tournament.
The American organization Evil Geniuses (EG) is the 3rd in the ranking (544 million RUB). It became popular due to its Dota 2 team. In 2015, the team won The International 2015. EG is the only American team who consistently takes high positions in international tournaments. The prize pool won exceeds 1,4 billion RUB. It was Evil Geniuses the former Virtus.Pro player Roman “Ramzes” Kushnarev moved to.
EG did not have CS: GO team. In September 2019, the organization announced the acquire of the team from another organization for 192 million RUB. The team successfully plays under the new tag. It won several serious tournaments and led the world rating.
In 2018, Danish organization Astralis earned 352,6 million RUB. The organization is the most successful in CS: GO. It was created in 2016, and the level of its prize pool for 3 years reached 477,1 million RUB. Counter-Strike team is unique four-time winner of the World Cup. Since 2016, the team won over a half of the tournaments. It is interesting that the gamers of Astralis team are much more popular than the national football team players. The organization successfully creates its clothing line in collaboration with the global brand Jack & Jones.
Ninjas in Pyjamas closes the ranking (163,8 million RUB). The most successful organization in the world was established in 1999 in Sweden. In 2007, the project was closed, but in 2012 it recommenced the activities. The organization became famous thanks to its Counter-Strike team. Gamers won the World Cup, and were unequaled for 2 years. The team got 87 winning streak without defeats. Over its history, the organization received 263,8 million RUB of prize pool.
Another US eSports organization Cloud9 is outside the ranking. Its income level in 2018 exceeded 1,8 billion RUB. The organization successfully applies business ideas to its tag. It creates own clothing line with Puma, and is one of the most popular organizations in the North American region.
The ranking results showed that eSports in the world is developing. Large companies are gradually exploiting the computer sports market, showing that it is not only entertaining, but also commercially profitable. Joint production of clothes, advertising on the Internet, recognition and media, all this helps not only to recapture investments, but also to receive multimillion-dollar profits. This trend cannot go unnoticed, so in the near future large companies will come to the Russian eSports segment.