
Order a report
Custom-made industry research, company ratings, competitor analysis


Trends in woodworking industry
Information Agency Credinform presents a review of activity trends of the largest Russian woodworking companies.
Woodworking companies with the largest annual revenue (TOP-10 and TOP-1000) have been selected for the analysis, according to the data from the Statistical Register for the latest available accounting periods (2015 — 2017). The analysis was based on the data from the Information and Analytical system Globas.
Net asset value indicates fair value of corporate assets and is calculated annually as assets on balance less company’s liabilities. Net asset value is negative (insufficiency of property) if liabilities are larger than the property value.
| № | Name, INN, region, activity | Net asset value, billion RUB | Solvency index Globas | ||
| 2015 | 2016 | 2017 | |||
| 1 | 2 | 3 | 4 | 5 | 6 |
| 1 | KRONOSPAN LLC INN 5011021227 Moscow region Manufacture of plywood, veneered panels and similar sandwich-type materials, wood-based panels made of wood or other ligneous materials |
14,0 | |
|
205 Strong |
| 2 | EGGER DREVPRODUKT GAGARIN LLC INN 6723019741 Smolensk region Manufacture of plywood, veneered panels and similar sandwich-type materials, wood-based panels made of wood or other ligneous materials |
6,5 | |
|
299 Medium |
| 3 | EGGER DREVPRODUKT SHUYA LLC INN 7704267807 Ivanovo region Manufacture of plywood, veneered panels and similar sandwich-type materials, wood-based panels made of wood or other ligneous materials |
2,2 | |
|
220 Strong |
| 4 | SWISS KRONO LLC INN 4407006010 Kostroma region Manufacture of plywood, veneered panels and similar sandwich-type materials, wood-based panels made of wood or other ligneous materials |
5,4 | |
|
192 High |
| 5 | SYKTYVKAR PLYWOOD MILL LIMITED INN 1121009024 Komi Republic Manufacture of plywood, veneered panels and similar sandwich-type materials, wood-based panels made of wood or other ligneous materials |
2,0 | |
|
185 High |
| 996 | MODERN LUMBER TECHNOLOGY LTD INN 7840322535 Saint Petersburg Manufacture of plywood, veneered panels and similar sandwich-type materials, wood-based panels made of wood or other ligneous materials |
-4,0 | |
|
288 Medium |
| 997 | JSC INDUSTRIAL-WOODWORKING COMPLEX APSHERONSK INN 2325014338 Krasnodar territory Manufacture of lumber, except profiled, more than 6 mm thickness; manufacture of untreated railroad and tram sleepers from wood |
-5,3 | |
|
289 Medium |
| 998 | JSC KRASLESINVEST INN 2460205089 Krasnoyarsk territory Sawmilling and planing of wood |
-7,3 | |
|
279 Medium |
| 999 | TRANS-SIBERIAN FOREST COMPANY LTD INN 3808119644 Irkutsk region Sawmilling and planing of wood Process of being wound up, 18.05.2018 |
-10,9 | |
|
600 Insufficient |
| 1000 | RIMBUNAN HIJAU MDF LLC INN 2721143979 Khabarovsk territory Manufacture of products of wood, cork, straw and plaiting materials |
-12,7 | |
|
311 Adequate |
![]() — growth compared to prior period,
— growth compared to prior period, ![]() — decline compared to prior period.
— decline compared to prior period.
Average net assets of TOP-1000 companies tended to decrease during the last decade (Picture 1).
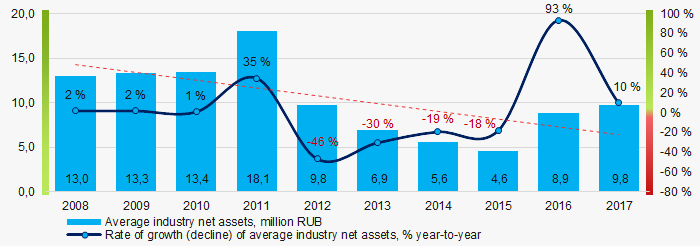 Picture 1. Change in average net assets of woodworking companies in 2008 — 2017
 The share of TOP-1000 companies with insufficiency of property tends to decrease within the last 3 years (Picture 2).
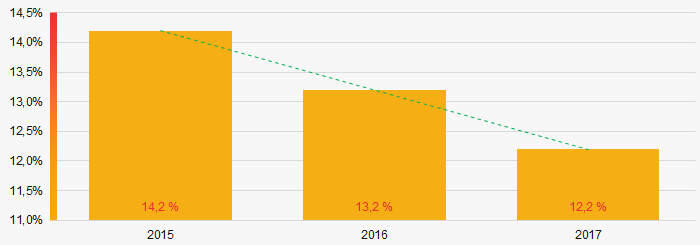 Picture 2. Share of TOP-1000 companies with negative value of net assets in 2015-2017
Sales revenue
In 2017 sales revenue of 10 leaders amounted to 21% of total revenue of TOP-1000 companies (Picture 3). This is an indicator of a relatively high level of competition within the industry.
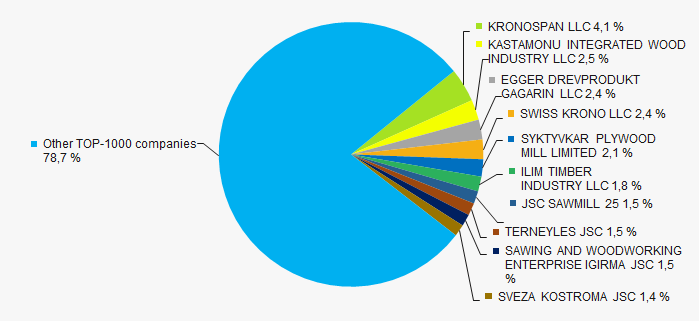 Picture 3. TOP-10 companies by their share in 2017 total revenue of TOP-1000 companies
 In general, average industry revenue tends to decrease during the decade (Picture 4).
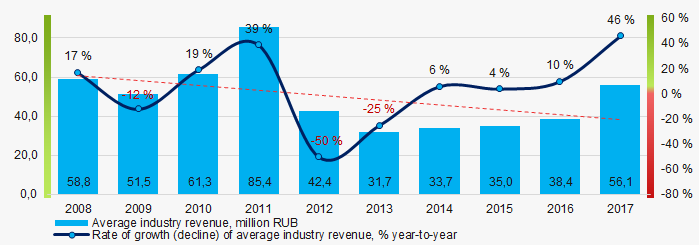 Picture 4. In general, average industry revenue tends to decrease during the decade (Picture 4).
 Profit and loss
n 2017 profit of 10 industry leaders amounted to 43% of total profit of TOP-1000 companies (Picture 5).
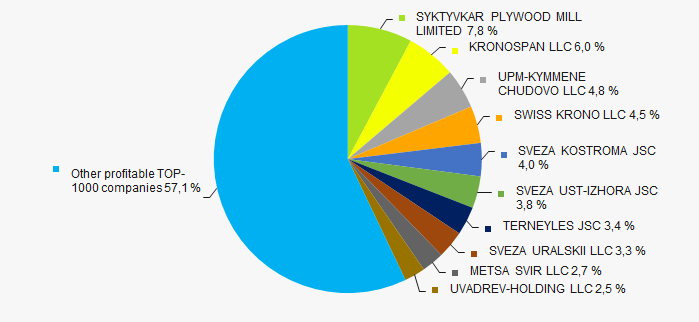 Picture 5. TOP-10 companies by their share in 2017 total profit of TOP-1000
Average net profit has mostly negative values, with a trend of the loss to increase (Picture 6).
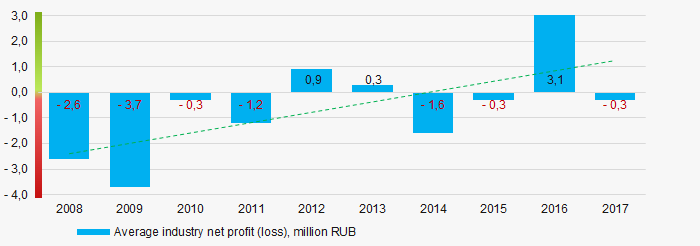 Picture 6. Change in average net profit (loss) of woodworking companies in 2008 — 2017
During the last 3 years average net profit of TOP-1000 companies neither increased nor decreased, with a trend of the loss to decrease (Picture 6).
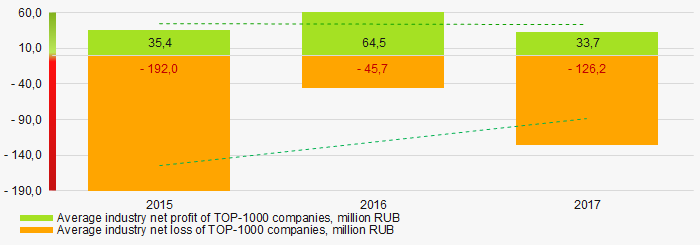 Picture 7. Change in average net profit and loss of TOP-1000 companies in 2015 — 2017
Key financial ratios
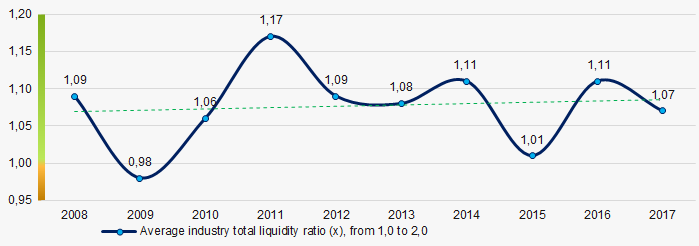
During the last decade average values of total liquidity ratio were within the recommended value — from 1,0 to 2,0, tending to increase (Picture 8).
Total liquidity ratio (a ratio of current assets to current liabilities) reveals the sufficiency of a company’s funds for meeting its short-term liabilities.
 Picture 8. Change in average values of total liquidity ratio of woodworking companies in 2008 — 2017
During the last decade, average values of return on investment ratio were in the negative area, but tending to increase (Picture 9).
It is a ratio of net profit to total equity and noncurrent liabilities, and it demonstrates benefit from equity engaged in business activity and long-term raised funds of the company.
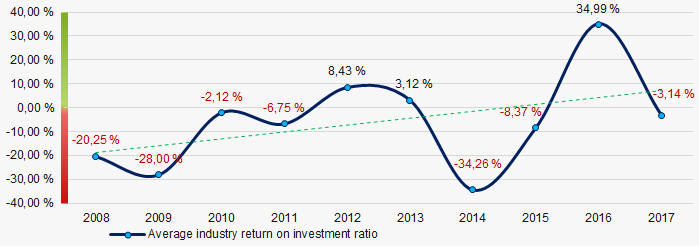 Picture 9. Change in average values of return on investment ratio of woodworking companies in 2008 — 2017
Assets turnover ratio is a ratio of sales revenue to average total assets for the period, and it measures resource efficiency regardless of the sources. The ratio indicates the number of profit-bearing complete production and distribution cycles per annum.
During the decade, this activity ratio tended to increase (Picture 10).
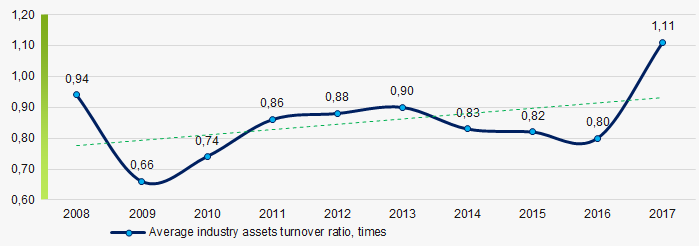 Picture 10. Change in average values of assets turnover ratio of woodworking companies in 2008 — 2017
Activities structure
Manufacture of plywood, veneered panels and similar sandwich-type materials, wood-based panels made of wood or other ligneous materials has the majority share in total revenue of TOP-1000 companies (Picture 11).
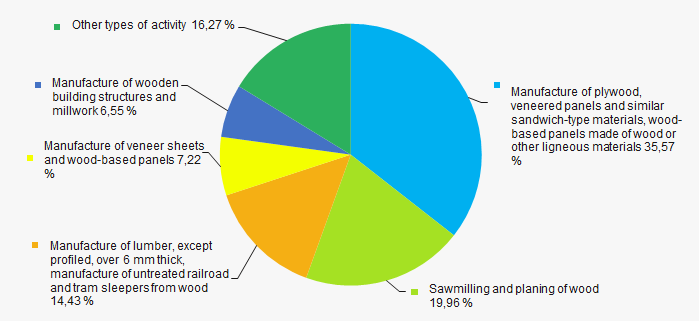 Picture 11. Types of activity by their share in total revenue of TOP-1000 companies
78% of TOP-1000 companies are included in the register of small and medium-sized businesses of the Federal Tax Service of the Russian Federation. In general, their share in total revenue of TOP-1000 in 2017 amounted to 22% (Picture 12).
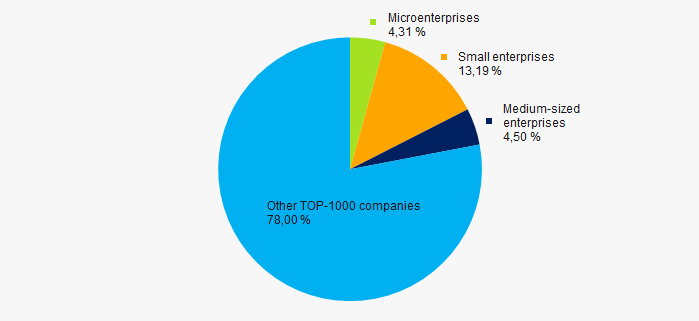 Picture 12. Shares of small and medium-sized enterprises in TOP-1000 companies' revenue, %
Key regions of activity
TOP-1000 companies are unevenly located throughout Russian territory, and are registered in 71 region. Companies with the largest revenue are concentrated in the Irkutsk and Moscow regions (Picture 13).
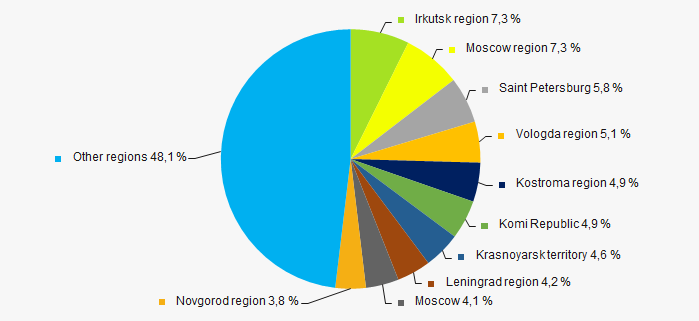 Picture 13. Revenue of TOP-1000 companies by Russian regions
Financial position score
Assessment of financial state of TOP-1000 companies indicates that most of the companies have an average financial standing (Picture 14).
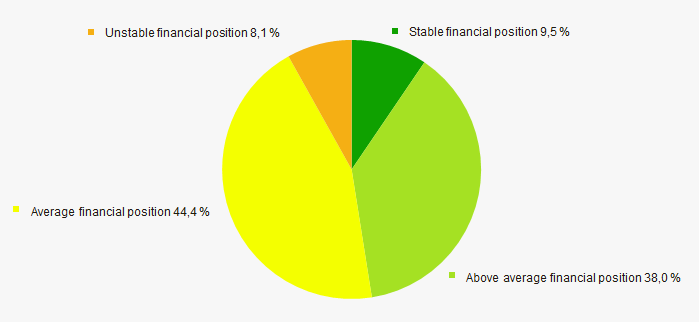 Picture 14. Assessment of financial state of TOP-1000 companies indicates that most of the companies have an average financial standing (Picture 14).
Solvency index Globas
he majority of TOP-1000 companies have got a superior, high, strong or medium Solvency index Globas, that indicates their capability to meet liabilities timely and in full (Picture 15).
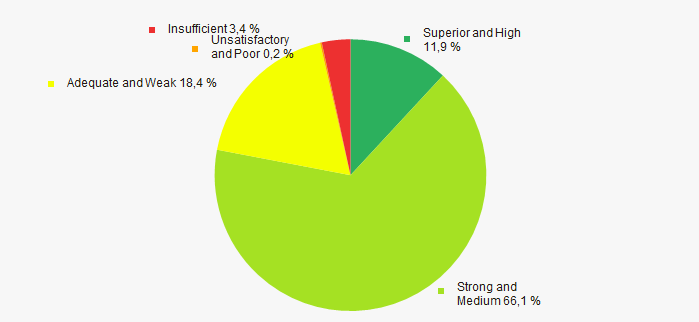 Picture 15. TOP-1000 companies by Solvency index Globas
Index of industrial production
According to the Federal State Statistics Service, during 12 months of 2018 the trend of some decrease of the index of industrial production is observed in the woodworking industry (Picture 16).
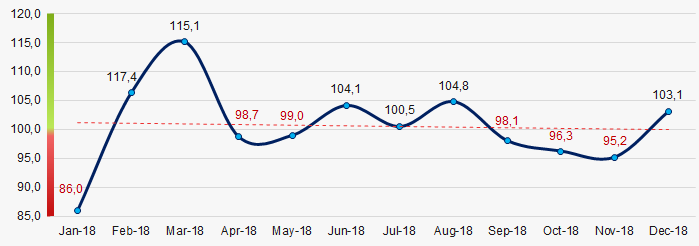 Picture 16. Index of industrial production in woodworking industry in 2018, month-to-month, (%)
Conclusion
A comprehensive assessment of the largest woodworking companies, that considers key indexes, financial figures and ratios, is indicative of predominance of positive trends within the sector (Table 2).
| Trends and assessment factors | Relative share of the factor, % |
| Rate of growth (decline) of average industry net assets | |
| Increase/ Decrease of share of companies with negative net assets | |
| Rate of growth (decline) of average industry revenue | |
| Level of competition / monopolization | |
| Rate of growth (decline) of average industry net profit (loss) | |
| Increase/ Decrease of average industry net profit of TOP-1000 companies | |
| Increase/ Decrease of average industry net loss of TOP-1000 companies | |
| Increase/ Decrease of average industry total liquidity ratio | |
| Increase/ Decrease of average industry return on investment ratio | |
| Increase/ Decrease of average industry assets turnover ratio | |
| Share of small and medium-sized business within the industry by revenue over 30% | |
| Regional concentration | |
| Financial standing (majority share) | |
| Solvency index Glogas (majority share) | |
| Index of industrial production | |
| Average factors' value | |
![]() — positive trend (factor) ,
— positive trend (factor) , ![]() — negative trend (factor).
— negative trend (factor).