
Order a report
Custom-made industry research, company ratings, competitor analysis


Shadow-fighting
Under its Transparent Business project, the Federal Tax Service has disclosed information about 2.5 million out of 4.2 million active legal entities. This data was formerly considered a tax secrecy.
Almost 40% of Russian companies stayed in the shadow.
Since August 2018, the Federal Tax Service has started to publish data that is not a tax secrecy anymore. This information is available only concerning legal entities, excluding major taxpayers, defense and strategic enterprises. Data concerning the latter are to be disclosed in 2020.
Information disclosed is relevant as of December 31, 2017.
Average number of employees
Companies are to give an account of their last year’s average number of employees to tax authorities (Paragraph 3 Article 80 of the Tax Code of the Russian Federation). This information is to be provided by all enterprises whether or not they perform actual activity or in fact have employees.
42% (or over one million) of companies that provided reports, have only one employee, and 15% of enterprises do not have staff at all (see Picture 1).
Absence of staff or a number that is obviously insufficient for activity increases the risk of the company to turn out to be a shell company or an abandoned business. However, there are other reasons:
- Aspects of record keeping: only full-time employees are included in the data of the Federal Tax Service, whereas a significant part of Russian companies has contractor or secondary employment agreements with their employees. In addition, the employees on maternity or educational leave are not included in the data.
- Tax minimization: wage bill has the burden of social security contributions, so the employers do not get full-time employees.
- Nature of activities: these days a company can be competitive and even successful without a large number of employees. Tasks are transferred to subcontractors, and the company’s director just coordinates the work.
- Errors: disclosed information is provided by legal persons themselves. The Federal Tax Service recommends that they “provide error-correcting reports with valid data without delay”. An example is EXPRESS LLC. On August 1, 2018 when the data was published, the company had 698,000 employees. For comparison, Russian Railways, the largest Russian employer, employs 737,000 people.
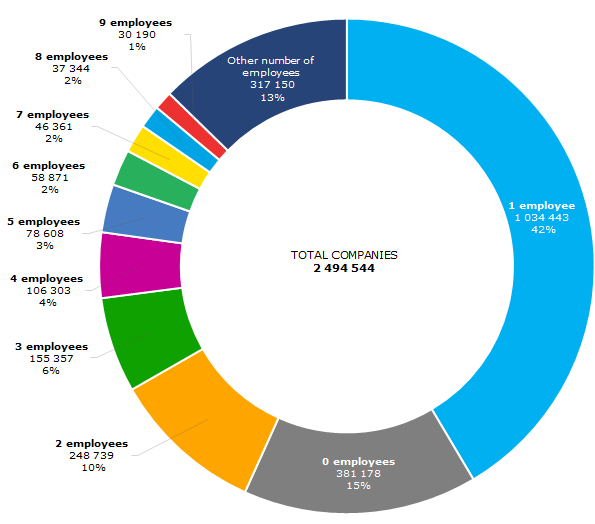 Picture 1. Companies by average number of employees according to the Federal Tax Service, as of 31.12.2017
Total income and expenditure
Data concerning total income and expenditure is provided from financial accounts. 2.5 million companies provided this information to the Federal Taxation Service.
Total income = revenue + income from participation in other companies + interest receivable + other income.
Total expenditure = cost of sales + selling and marketing expenses + administrative expenses + interest payable + other expenses.
In case of lack of balance sheet, this data gives an overview of size of business, and if the financial account is available – it can be used for additional comparison and check of figures from official sources, as they sometimes contain errors.
In particular, financials of ADAM-S LLC: a1b99439d89e raise doubts: this company from Ingushetia reported the Federal Taxation Service to have revenue of 122 trillion rubles, at the same time a revenue of 121 million rubles is stated in the balance sheet.
Paid taxes and fees
Total taxes and fees paid by the company during the calendar year, excluding total taxes and fees paid for import to the customs territory of the Eurasian Economic Union (EEU), are to be included.
2.1 million companies disclosed this information. Minimum taxes paid indicate that the company does not perform business activity. For example, DIAMANT LLC .36 ruble of taxes to all budgets in 2017
See the statistics of types of paid taxes and their regional distribution below.
2.2 trillion rubles or 39% of all taxes paid by companies is VAT. Insurance contributions for compulsory pension insurance are ranked second with 1.3 trillion rubles, and the next one is profit tax – 1 trillion rubles (see Table 1).
Table 1. Total taxes paid by companies in 2017, by tax types
| Rank | Tax | Total paid taxes, billion rubles | Share of the tax in paid taxes, % |
| 1 | VAT | 2238 | 39 |
| 2 | Insurance and other contributions for compulsory pension insurance | 1316 | 23 |
| 3 | Profit tax | 958 | 17 |
| 4 | Insurance contributions for compulsory health insurance | 314 | 6 |
| 5 | Corporate property tax | 195 | 3 |
| - | Other taxes | 685 | 12 |
| Total | 5679 | 100 |
Moscow companies accumulate 35% of all paid taxes. Other regions are far behind the capital city. The ranking is to change after the disclosure of major taxpayers, especially in the regions in which fuel and energy companies are registered.
Table 2. Total taxes paid by companies in 2017, by regions
| Rank | Region | Total paid taxes, billion rubles | Share of the region in paid taxes, % |
| 1 | Moscow | 2002 | 35 |
| 2 | Saint Petersburg | 437 | 8 |
| 3 | Moscow region | 397 | 7 |
| 4 | Krasnodar territory | 198 | 3 |
| 5 | Republic of Tatarstan | 138 | 2 |
| - | Other regions | 2507 | 45 |
| Total | 5679 | 100 |
Special tax regimes
Special tax regime is set based on activity type, number of employees and company’s revenue. Legislation allows simultaneous application of several special tax regimes, and combination of some of them with general taxation system.
The Federal Tax Service published information concerning 1.9 million companies that apply special tax regime. Almost 90% of companies use Simplified Tax System (STS). 5% of companies combine STS with Unified Tax on Imputed Income (UTII) (see Table 3).
Table 3. Main types of special tax treatment used by companies in 2017.
| Unified Agricultural Tax | STS | UTII | Number of companies | Share of total number of companies that provided information about using special tax regime, % |
| + | 1734746 | 90 | ||
| + | + | 103802 | 5 | |
| + | 83923 | 4 | ||
| + | 14776 | 1 | ||
| Production sharing agreement and other combinations of tax treatment | 1329 | <0 | ||
Consolidated group of taxpayers
Consolidated group of taxpayers (CGT) is a voluntary alliance of companies created for payment of profit tax for total financial result of all group.
The group can be created if one company is a direct or indirect shareholder of others (share in each of them is not less than 90%).
Member of CGT is a company that is a party of an active agreement of creation of a consolidated group of taxpayers.
Responsible member of CGT is the member that, according to the agreement of creation of a consolidated group, has the duty to charge and pay profit tax of all companies of the group.
The Federal Tax Service disclosed data concerning 88 companies that are members of consolidated groups.
Summary
- Having disclosed this data about companies, the tax service has received a point in the dispute concerning its right to charge additional tax. In case of a tax dispute with a taxpayer the Federal Tax Service may appeal to availability of information concerning counterparties.
- Business community has received a new source of information about companies’ activities.
- Released data is an auxiliary tool, as an overall assessment of a company includes many other, no less important information, as well as a comprehensive analysis that is possible only by means of a professional Information and Analytical system.
On December 1, 2018 the Federal Tax Service plans to publish information about arrears, companies’ tax debts and data concerning tax violations. This information will help Globas users to assess a company’s tax burden and to avoid the risk of cooperation with an abusive taxpayer.