
Order a report
Custom-made industry research, company ratings, competitor analysis


Countries worldwide in terms of balance of payments
The most important indicator characterizing the national development is the balance of payments (BoP). This is a statement that reflects all economic transactions made between residents and non-residents that took place during the reporting period.
The difference between the sum of economic transactions between residents of states forms the net balance of payments. An external surplus (BoP surplus) leads to an inflow of foreign currency into a country and an increase in foreign exchange reserves. By external imbalance (BoP deficit), the Central Bank reduces its foreign exchange reserves. In other words, BoP deficit points to unprofitability of a state on a world stage as a whole: the country spends more than it earns.
The data in the balance of payments are grouped into three accounts: current account, capital account and financial account. The current account is the most significant indicator because it reflects the real economy, and not speculation in capital.
The current account includes the following: flow of goods, services (export and import), taxes, interstate transfers, personal transfers, payment for labour, investment incomes, rent, capital transfers between residents and non-residents (grants, inheritance).
According to the results of Q1-Q3 of 2018, Germany demonstrates the maximum external surplus on the current account: 224,2 billion USD. Japan takes the second place with 151,2 billion USD. Russia is the third with an indicator of 76,1 billion USD.
If we take the average annual current account balance for the past 10 years, then the unique situation is in China: the average current account balance amounted to 230,9 billion USD (the 2nd place in the world) in 2007-2017. In 2018 it became less than zero for the first time, that is explained by the negative balance of labour expense, investment incomes and rent between residents and non-residents. This phenomenon may indicate the beginning of the migration of labor resources and savings from the PRC. If the trend is steady or not, the near future will show.
| № | Country | BoP on the current account for Q1-Q3 of 2018, billion USD | Average annual BoP on the current account for 2007-2017, billion USD |
| 1 | Germany | 224,2 | 251,6 |
| 2 | Japan | 151,2 | 130,7 |
| 3 | Russia | 76,1 | 60,7 |
| 4 | Netherlands | 68,9 | 68,2 |
| 5 | Saudi Arabia | 57,9 | 68,2 |
| 6 | Republic of Korea | 57,7 | 58,4 |
| 7 | Switzerland | 57,1 | 59,0 |
| 8 | Singapore | 50,5 | 51,1 |
| 9 | Italy | 36,0 | -6,5 |
| 10 | Ireland | 34,4 | 9,2 |
| China | -6,9 | 230,9 |
Source: IMF, calculations of Credinform
The United States leads the ranking of countries with the largest negative current account balance. For Q1-Q3 of 2018 the value reached an impressive volume -350,7 billion USD, and the average figure for the last 10 years - 436,1 billion USD. The state is chronically unprofitable.
| № | Country | BoP on the current account for Q1-Q3 of 2018, billion USD | Average annual BoP on the current account for 2007-2017, billion USD |
| 1 | USA | -350,7 | -436,1 |
| 2 | Great Britain | -50,2 | -111,5 |
| 3 | India | -48,1 | -41,5 |
| 4 | Canada | -37,7 | -46,5 |
| 5 | Turkey | -29,9 | -43,8 |
| 6 | Argentina | -25,8 | -8,3 |
| 7 | Australia | -24,6 | -48,0 |
| 8 | Indonesia | -22,4 | -11,5 |
| 9 | France | -19,3 | -23,8 |
| 10 | Mexico | -17,0 | -19,0 |
Source: IMF, calculations of Credinform
In Russia, for all time of observations, the current account was negative or became zero only in 1997-1998 (s. Picture 1).
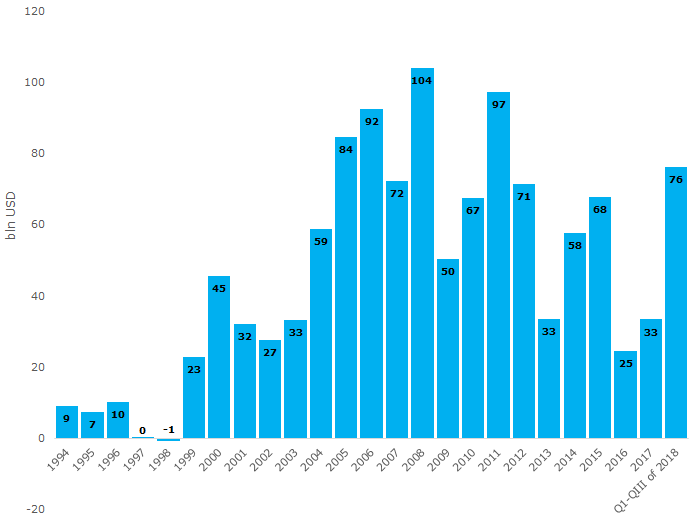 Picture 1. Dynamics of the balance of payments of Russia on the current account