Order a report
Custom-made industry research, company ratings, competitor analysis


Dynamics of the industrial production in Russia for 7 months of 2020
In January-July 2020, industrial production in Russia reduced by 4,2% comparing to the same period of the previous year. The maximum reduction to 9,6% was recorded in May. Since June there is an emerging trend to improve the situation.
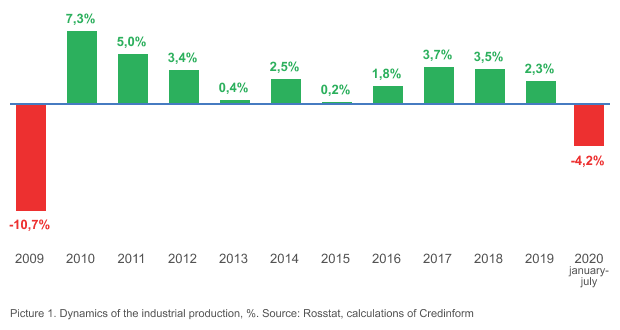
The negative annual dynamics in the manufacturing industry was recorded also in 2009, the reduction was 10,7%.
Manufacturing recovers, and mining industry continues to slow down
In March 2020, manufacturing had an increase by 2,6% comparing to March 2019. After the restrictions imposed in April, there was recorded a slow down by 10% in comparison with April 2019. In July 2020, the reduction became slower and was 3,3% comparing to July 2019.
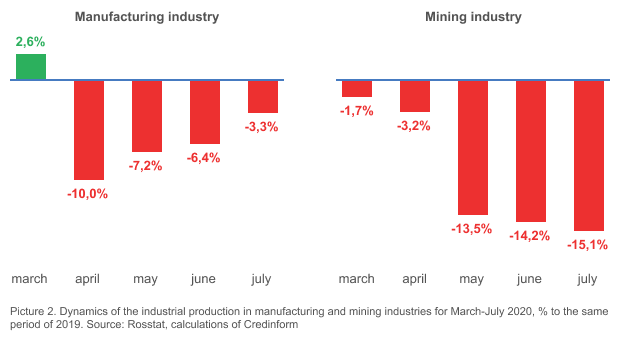 In March 2020, mining was slightly decreased by 1,7%. However, in April-June the decline increased and reached 15,1% in July. For a long time, oil and gas industry will be affected by negative demand for energy resources, as well as obligations of Russia as part of OPEC+ new deal.
Not oil alone
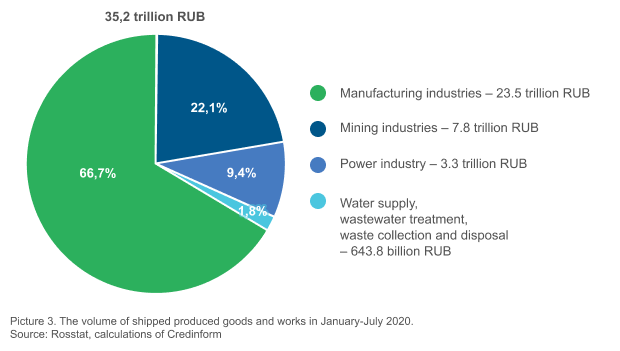
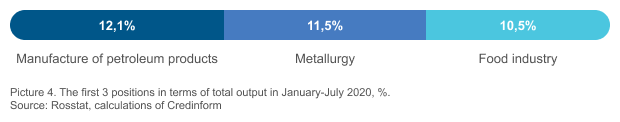
In the structure of the industry, the share of sectors producing products with high added value is increasing. In January-July 2020, manufacturing industries produced 66,7% of the total volume of goods, works and services in monetary terms; 22,1% - mining industries, 9,4% – electrical energy industry, 1,8% – water supply, wastewater disposal, waste collection and disposal. This dynamics of increasing the share of manufacturing industries has been traced for several years.
The structure of manufacturing industry
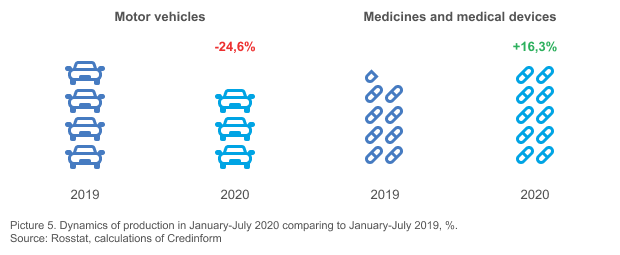
Manufacturing: affected sectors and growth leaders
Automotive production is the worst affected sector of the manufacturing industry: in January-July 2020, the automotive industry decreased by 24,6% compared to the same period in 2019.
Enterprises producing medicines and medical devices benefited significantly: for 7 months of 2020, they increased supplies by 16,3%.
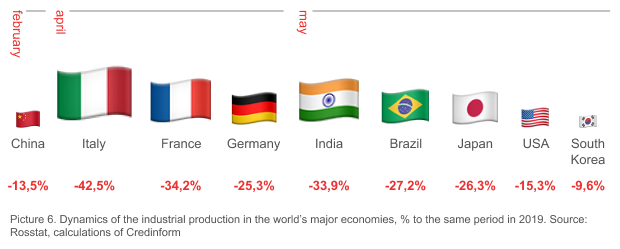
Crisis in industrial production of world’s major economies
The current situation has affected the world's industrial centers in different ways. The maximum decline in production, comparing to the same period in 2019, was recorded in April 2020: 42,5% in Italy, 34,2% in France, and 25,3% in Germany. In May 2020, there was the peak of the industrial crisis in India with a slow down by 33,9%, Brazil – 27,2%, Japan – 26,3%, the USA – 15,3%, and South Korea – 9,6 %.
China experienced the consequences of the pandemic earlier than other countries: the maximum decline by 13,5% was recorded in February 2020.