TOP of construction companies in Saint Petersburg
Information agency Credinform represents a review of activity trends among construction companies in Saint Petersburg.
The largest companies with the highest annual revenue (TOP 1000) were selected for the ranking, according to the data from the Statistical Register and the Federal Tax Service for the latest available periods (2016 – 2020). The selection and analysis of companies were based on the data of the Information and Analytical system Globas.
Net assets are total assets less total liabilities. This indicator reflects the real value of the property of an enterprise. When the company’s debt exceeds the value of its property, the indicator is considered negative (insufficiency of property).
The largest company in term of net assets is JSC ETALON LENSPETSSMU, INN 7802084569, construction of residential and non-residential buildings. In 2020, net assets value of the company exceeded 39 billion RUB.
The lowest net assets value among TOP 1000 was recorder for LLC STROIGAZKONSALTING, INN 7703266053, construction of residential and non-residential buildings. In 2020, insufficiency of property of the enterprise was indicated in negative value of -28 billion RUB.
Covering the five-year period, the average net assets values of TOP 100 have a trend to decrease with the increasing growth rate (Picture 1).
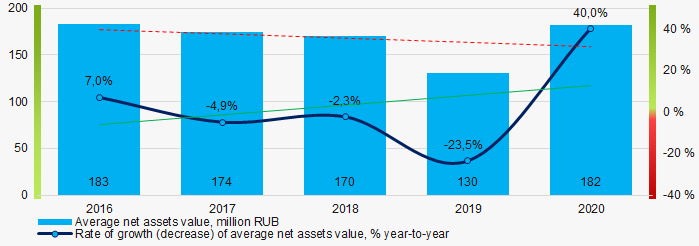 Picture 1. Change in industry average net assets value in 2016 – 2020
Over the past five years, the share of companies with insufficient property had a positive trend to decrease (Picture 2).
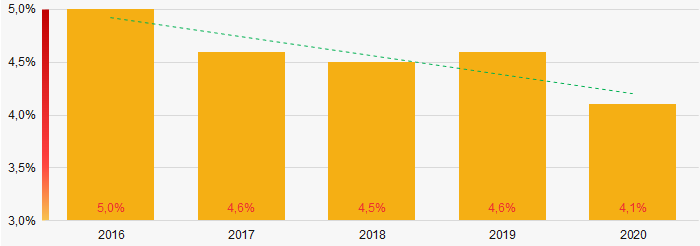 Picture 2. Shares of TOP 1000 companies with negative net assets value in 2016-2020
Sales revenue
In 2020, the revenue volume of ten largest companies was near 34% of total TOP 1000 revenue (Picture 3). This is indicative of a relatively high level of competition among construction companies in Saint Petersburg.
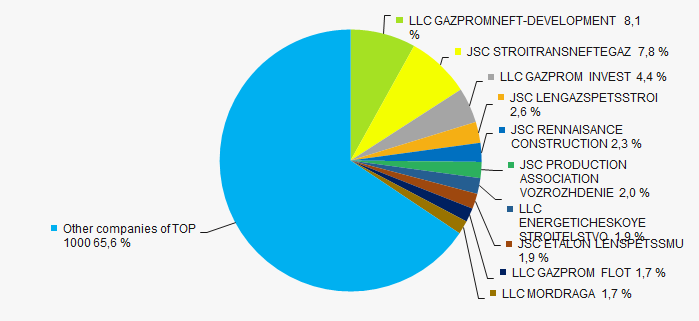 Picture 3. The share of TOP 10 companies in total 2020 revenue of TOP 1000
 In general, there is a trend to decrease in revenue and growth rate (Picture 4).
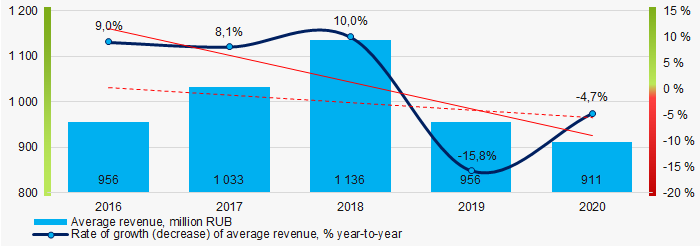 Picture 4. Change in industry average net profit in 2016 – 2020
Profit and loss
In 2020, the largest organization in term of net profit is ООО GAZPROM INVESTGAZIFIKATSIYA, INN 7810170130, construction of engineering communications for water supply and sewerage, gas supply. The company’s profit almost exceeded 16 billion RUB.
Covering the five-year period, there is a trend to increase in average net profit and growth rate (Picture 5).
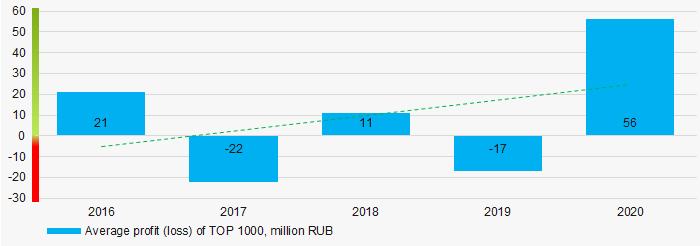 Picture 5. Change in average profit (loss) values in 2016 – 2020
For the five-year period, the average net profit values of TOP 1000 have the increasing trend with the decreasing net loss (Picture 6).
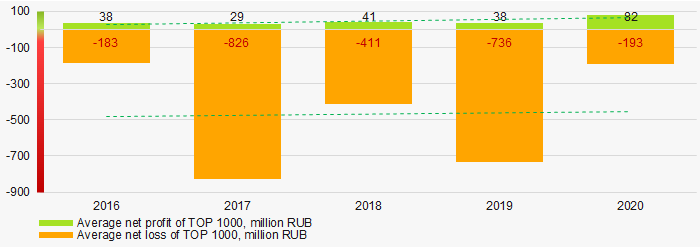 Picture 6. Change in average net profit and net loss of ТОP 1000 in 2016 - 2020
Key financial ratios
Covering the five-year period, the average values of the current liquidity ratio were close the recommended one - from 1,0 to 2,0 with a trend to decrease (Picture 7).
Current liquidity ratio (current assets to short-term liabilities) shows the sufficiency of company’s assets to repay on short-term liabilities.
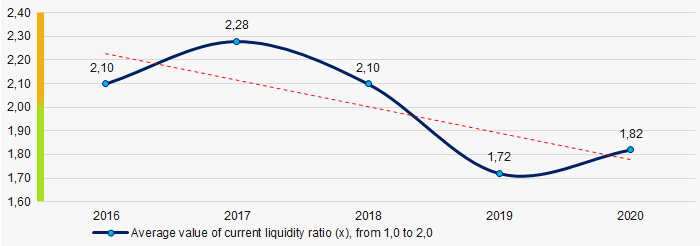 Picture 7. Change in industry average values of current liquidity ratio in 2016 – 2020
Covering the five-year period, the average values of ROI ratio had a trend to increase (Picture 8).
ROI ratio is calculated as net profit to sum of shareholders equity and long-term liabilities, and shows the return of equity involved in commercial activities and long-term borrowed funds.
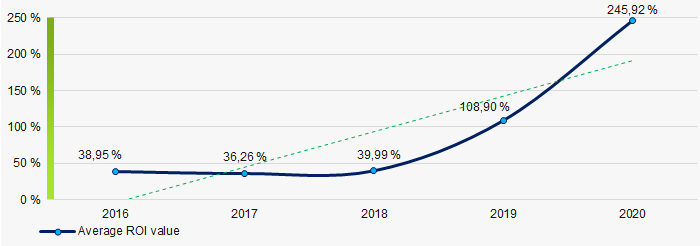 Picture 8. Change in industry average values of ROI ratio in 2016 - 2020
Assets turnover ratio is the ratio of sales revenue and company’s average total assets for a period. It characterizes the effectiveness of using of all available resources, regardless the source of their attraction. The ratio shows how many times per year the full cycle of production and circulation is performed, generating the corresponding effect in the form of profit.
Covering the five-year period, business activity ratio demonstrated the decreasing trend (Picture 9).
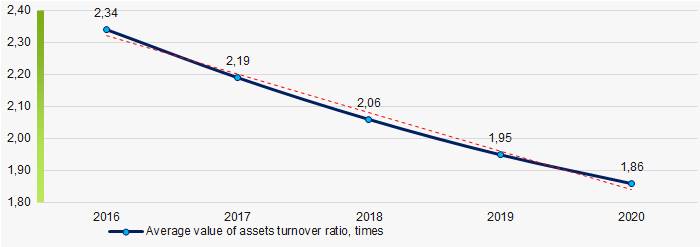 Picture 9. Change in average values of assets turnover ratio in 2016 – 2020
Small business
87% of companies of TOP 1000 are registered in the Register of small and medium-sized enterprises of the Federal Tax Service of the Russian Federation. In 2020, their share in total revenue of TOP 1000 is 31%, more than the average country values in 2018-2019 (Picture 10).
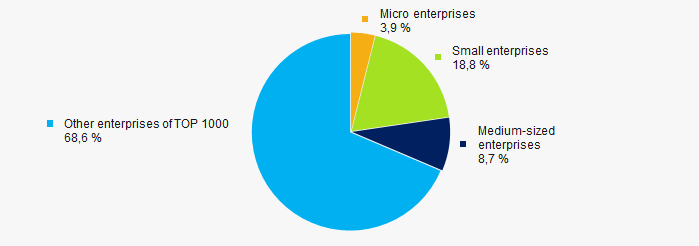 Picture 10. Shares of small and medium-sized enterprises in TOP 1000
Financial position score
Assessment of the financial position of TOP 1000 companies shows that the majority of them have average financial position (Picture 11).
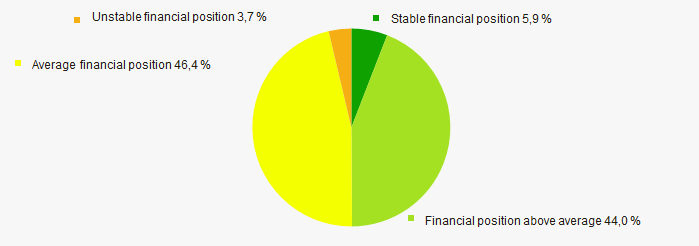 Picture 11. Distribution of TOP 1000 companies by financial position score
Solvency index Globas
Most of TOP 1000 companies got Superior / High and Strong / Medium indexes Globas. This fact shows their limited ability to meet their obligations fully (Picture 12).
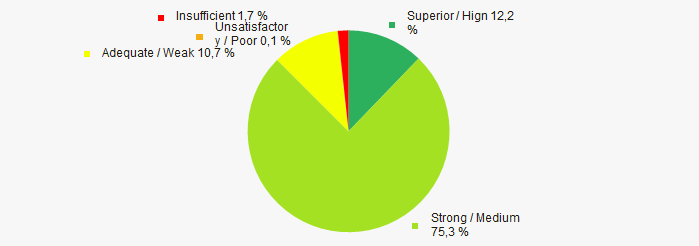 Picture 12. Distribution of TOP 1000 companies by solvency index Globas
Conclusion
Complex assessment of activity of construction companies of Saint Petersburg, taking into account the main indexes, financial ratios and indicators, demonstrates the prevalence of positive trends in 2016 - 2020 (Table 1).
| Trends and evaluation factors | Relative share of factors, % |
| Dynamics of the average net assets value |  -10 -10 |
| Rate of growth (decrease) in the average size of net assets |  10 10 |
| Increase (decrease) in the share of enterprises with negative values of net assets |  10 10 |
| Level of concentration of capital (monopolization) |  10 10 |
| Dynamics of the average revenue |  -10 -10 |
| Rate of growth (decrease) in the average size of revenue |  -10 -10 |
| Dynamics of the average profit (loss) |  5 5 |
| Rate of growth (decrease) of the average profit |  10 10 |
| Rate of growth (decrease) of the average loss |  10 10 |
| Increase / decrease in average values of total liquidity ratio |  -5 -5 |
| Increase / decrease in average values of return on investment ratio |  10 10 |
| Increase / decrease in average values of asset turnover ratio, times |  -10 -10 |
| Share of small and medium-sized businesses in terms of revenue being more than 20% |  10 10 |
| Financial position (the largest share) |  5 5 |
| Solvency index Globas (the largest share) |  10 10 |
| Average value of relative share of factors |  3,0 3,0 |
 positive trend (factor),
  negative trend (factor)
TOP 10 construction companies in Saint Petersburg
Information agency Credinform represents a ranking of the engineering construction companies in Saint Petersburg. Companies engaged in construction of engineering communications for water supply, sewerage and gas supply with the largest volume of annual revenue (TOP 10 and TOP 100) were selected for the ranking, according to the data from the Statistical Register and the Federal Tax Service for the latest available periods (2018 - 2020). They were ranked by the return on the authorized capital (Table 1). The selection and analysis were based on the data of the Information and Analytical system Globas.
Return on the authorized capital (%) indicates the efficiency of the authorized capital use and shows the amount of net profit accounting for one rouble of the authorized capital.
The higher is the indicator, the more efficient is the usage of capital contributed to the authorized fund. However, it is necessary to consider that too high values, exceeding in several times the average values for economy or sector may indicate low authorized capital at higher net profit.
For the most complete and objective view of the financial condition of the enterprise, it is necessary to pay attention to the complex of indicators and financial ratios of the company.
| Name, INN | Revenue, billion RUB | Net profit (loss), billion RUB | Return on the authorized capital, % | Solvency index Globas | |||
| 2019 | 2020 | 2019 | 2020 | 2019 | 2020 | ||
| 1 | 2 | 3 | 4 | 5 | 6 | 7 | 8 |
| OOO ROSSBILDING INN 2130032913 |
 2,11 2,11 |
 4,32 4,32 |
 0,22 0,22 |
 0,86 0,86 |
 1 465 327 1 465 327 |
 5 707 780 5 707 780 |
165 Superior |
| LLC INTERLINE ENGINEERING INN 7805412169 |
 1,71 1,71 |
 3,57 3,57 |
 0,36 0,36 |
 0,72 0,72 |
 2 273 438 2 273 438 |
 4 515 756 4 515 756 |
150 Superior |
| LLC STROIGAZKOMPLEKT INN 0601003655 |
 4,78 4,78 |
 2,04 2,04 |
 0,34 0,34 |
 0,06 0,06 |
 3 395 940 3 395 940 |
 598 020 598 020 |
216 Strong |
| LLC PERVIY TREST INN 7816644073 |
 2,38 2,38 |
 2,09 2,09 |
 0,01 0,01 |
 0,02 0,02 |
 49 487 49 487 |
 53 880 53 880 |
291 Medium |
| LLC GAZPROM INVESGASIFICATION INN 7810170130 |
 7,49 7,49 |
 5,57 5,57 |
 -1,75 -1,75 |
 16,66 16,66 |
 -4 475 -4 475 |
 42 682 42 682 |
267 Medium |
| JSC STROITRANSNEFTEGZ INN 7714572888 |
 164,18 164,18 |
 71,39 71,39 |
 5,36 5,36 |
 1,60 1,60 |
 92 406 92 406 |
 27 531 27 531 |
271 Medium |
| LLC GAZPROM INVEST INN 7810483334 |
 48,41 48,41 |
 39,68 39,68 |
 -1,38 -1,38 |
 5,44 5,44 |
 -741 -741 |
 2 916 2 916 |
257 Medium |
| LLC REPAIR AND CONSTRUCTION OF PR AND SS NETWORKS INN 4725006039 |
 2,57 2,57 |
 1,93 1,93 |
 0,03 0,03 |
 0,04 0,04 |
 8 8 |
 9 9 |
230 Strong |
| LLC TONNELGEOSTROI INN 7825665993 |
 1,56 1,56 |
 3,03 3,03 |
 0,11 0,11 |
 0,06 0,06 |
 11 11 |
 6 6 |
225 Strong |
| JSC LRNGAZSPETSTROI INN 7806027191 |
 35,63 35,63 |
 23,63 23,63 |
 -6,82 -6,82 |
 -2,70 -2,70 |
 -13 649 916 -13 649 916 |
 -5 391 090 -5 391 090 |
303 Adequate |
| Average value for TOP 10 |  27,08 27,08 |
 15,73 15,73 |
 -0,35 -0,35 |
 2,27 2,27 |
 -637 852 -637 852 |
 555 749 555 749 |
|
| Average value for TOP 100 |  2,96 2,96 |
 1,83 1,83 |
 -0,02 -0,02 |
 0,24 0,24 |
 -88 816 -88 816 |
 131 083 131 083 |
|
| Average industry value |  0,12 0,12 |
 0,10 0,10 |
 0,001 0,001 |
 0,003 0,003 |
 14 14 |
 113 113 |
|
 growth of indicator to the previous period,
  fall of indicator to the previous period
The industry average values of the return on the authorized capital is significantly below the industry average ones of TOP 10 and TOP 100. One company of TOP 10 had negative value of the indicator. Three companies have reduced their figures in 2020. In 2019, the fall was recorded for six companies.
In 2020, three companies included in TOP 10 gained revenue and four legal entities gained net profit. In general, the revenue of TOP 10 fell at average 42%, and a 38% decrease was recorded in TOP 100. Average profit of TOP 10 climbed 7 times, and the 13-time increase was recorded for TOP 100. The industry average profit climbed 3 times.
Over the past five years, the industry average values of the return on the authorized capital have increased over two periods. The highest value was recorded in 2016 and the lowest one was in 2017 (Picture 1).
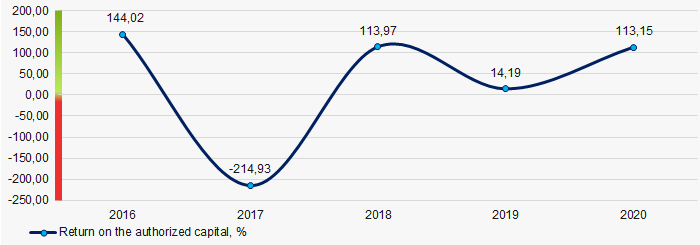 Picture 1. Change in the industry average values of the return on the authorized capital in 2016 - 2020