
Order a report
Custom-made industry research, company ratings, competitor analysis


TOP 1000 companies in Omsk
The need to build new scientific and industrial centers in Russia is one of the most relevant topics today. Continuing the cycle of publications about the largest cities of Russia, we offer a review of companies of one of the largest Siberian cities – Omsk. Positive trends prevail in activities of the largest companies in the period from 2016 to 2020, such as: decrease in the share of companies with insufficient property, increase in net assets, revenue and net profit. Among negative trends are increase in the average net loss value, decrease in asset turnover.
Information agency Credinform selected the largest companies of the city in terms of annual revenue for the last reporting periods available in the State Statistics bodies and the Federal Tax Service (2016-2020) (TOP 1000) for the analysis based on the data from the Information and Analytical system Globas.
Net assets is a ratio that reflects the real value of the company's property that is calculated annually as the difference between the assets on the company's balance sheet and its debt obligations. Net asset ratio is negative (insufficient property) if the company's debt exceeds the value of its property.
The largest company in the TOP 1000 in terms of net assets is JSC GAZPROMNEFT-OMSK REFINERY PLANT, INN 5501041254, production of petroleum products. In 2020, net assets amounted to more than 327 billion RUB.
STROYPRODUCT LLC had the smallest net assets in the TOP 1000, INN 5501093407, retail sale of unfrozen products, including beverages and tobacco products in non-specialized stores. The insufficiency of property in 2020 was expressed by a negative value of -443 million RUB.
During the five-year period, average net assets of TOP 1000 companies and their growth rates tend to increase (Picture 1).
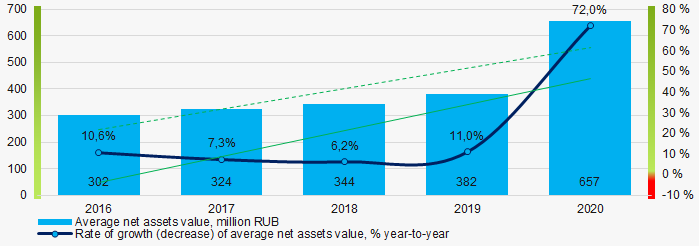 Picture 1. Change in average net assets of the TOP 1000 companies in 2016-2020
Shares of companies with property insufficiency in the TOP 1000 had a positive downward trend over the past five years (Picture 2).
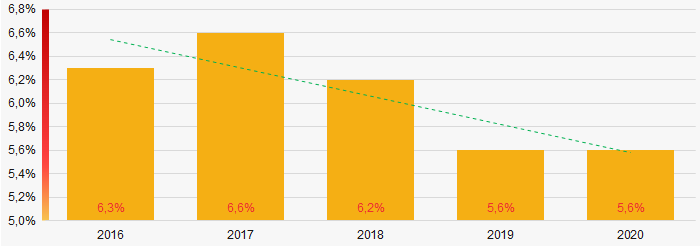 Picture 2. Shares of the TOP 1000 companies with negative net assets in 2016-2020
Sales revenue
Revenue of the TOP 10 companies in 2020 amounted to 33% of the total revenue of the TOP 1000 companies. (Pictures 3). This indicates a relatively high level of capital concentration among Omsk companies.
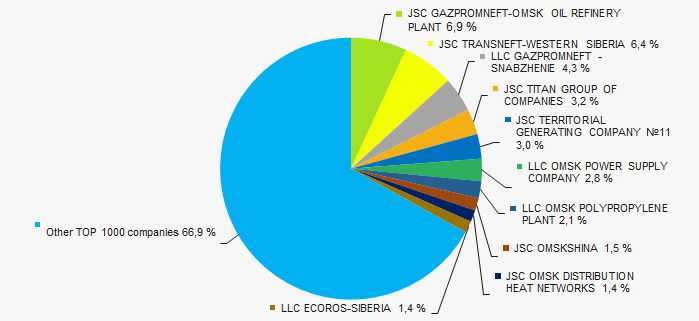 Picture 3. Shares of the TOP 10 companies in the total revenue in 2020 TOP 1000
In general, there is a trend in revenue and growth rates increasing. (Picture 4).
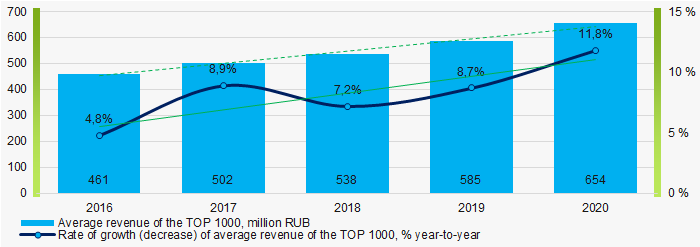 Picture 4. Change in average revenue values of the TOP-1000 companies in 2016-2020
Profit and loss
The largest company in the TOP 1000 in terms of net profit in 2020 is NAO TRANSNEFT-WESTERN SIBERIA, INN 5502020634, transportation of oil through pipelines. The profit amounted to over 5,9 billion RUB. Covering the five-year period average profit of the TOP 1000 companies tends to increase, with decreasing growth rates (Picture 5).
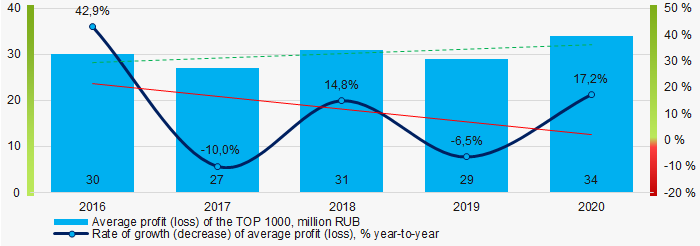 Picture 5. Change in average profit (loss) ratios of TOP-100 companies in 2016-2020.
Covering the five-year period, average values of net profit of the TOP 1000 companies are increasing, while average net loss is also growing (Picture 6).
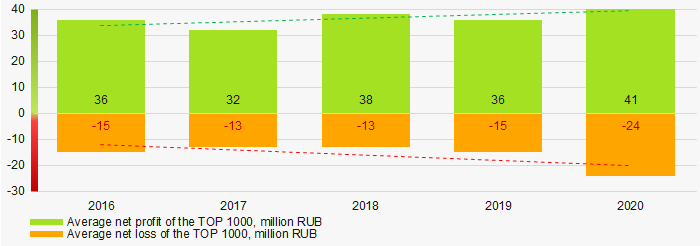 Picture 6. Changes in average values of net profit and net loss ratios of the TOP 1000 companies in 2016-2020
Key financial ratios
Covering the five-year period total liquidity ratio average values of the TOP 1000 were significantly exceeding the range of recommended values - from 1.0 to 2.0 with a trend to increase. (Picture 7).
Сurrent liquidity ratio (current assets to short-term liabilities) shows sufficiency of a company’s assets to settle short-term liabilities.
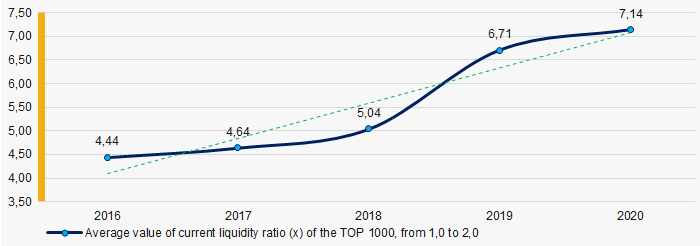 Picture 7. Changes in average values of total liquidity ratio of the TOP-1000 companies in 2016-2020.
Covering the five years period investments profitability ratio average values of the TOP 1000 has been at a high level with a trend to decrease (Picture 8).
This ratio is calculated as ratio of net profit to amount of equity and long-term liabilities and demonstrates return on equity involved in commercial activities and long-term funds raised by organization.
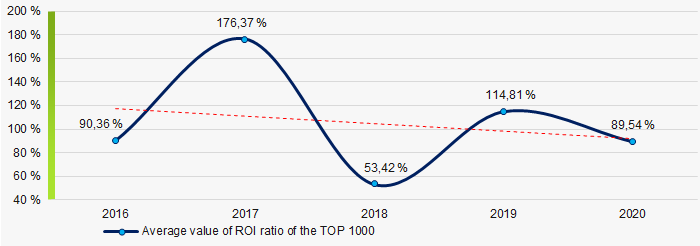 Picture 8. Change in investments profitability ratio average values of the TOP 1000 in 2016-2020.
Asset turnover ratio is calculated as ratio of sales revenue to average value of total assets for a period and implicates the efficiency of use of all available resources, regardless of the sources they were raised. The ratio shows how many times per year the full cycle of production and turnover is performed generating the corresponding effect in the form of profit.
During the five-year period values of the said business activity ratio showed a trend to decrease (Picture 9).
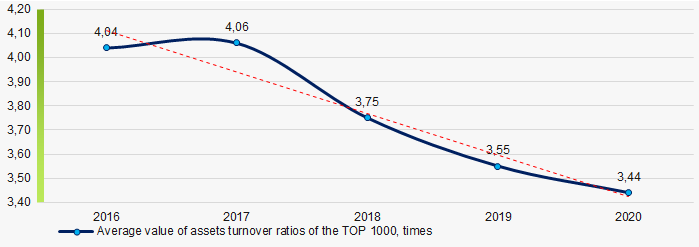 Picture 9. Change in asset turnover ratio average values of the TOP-1000 in 2016-2020.
Small enterprises
85% of the TOP 1000 companies are registered in the Unified Register of Small and Medium-Sized Enterprises of the Federal Tax Service of the Russian Federation. At the same time, the share of their revenue in the total volume of the TOP 1000 in 2020 is 27.5%, which is higher than the national average in 2018 - 2019. (Picture 10).
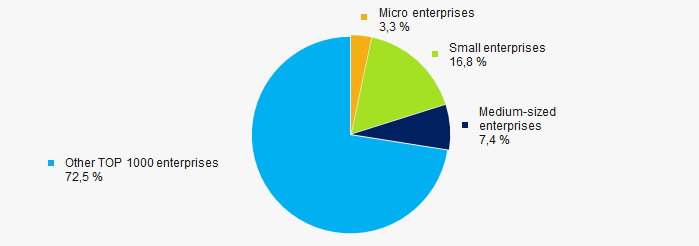 Picture 10. Revenue shares of small and medium-sized enterprises in the TOP-1000
Financial position score
Financial position assessment of the TOP 1000 companies shows that the largest part of them is in financial position above average. (Picture 11).
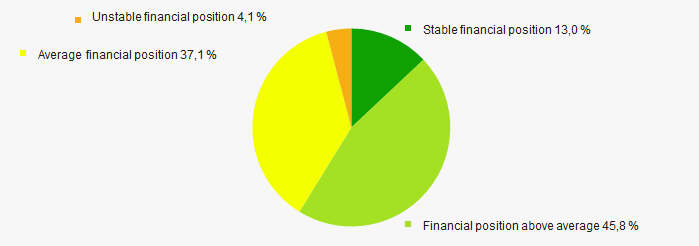 Picture 11. Distribution of the TOP 1000 companies by financial position score
Globas Solvency Index
The vast majority of TOP-100 companies are assigned superior and high Globas Solvency Index, which indicates their ability to repay their debt obligations on time and fully (Picture 12).
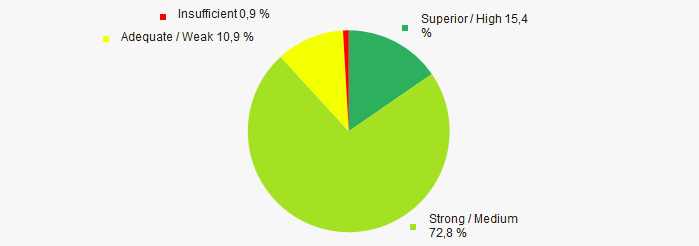 Picture 12. Distribution of the TOP 1000 companies according to the Globas Solvency Index
 Conclusion
Comprehensive assessment of activities of the largest Omsk companies, that takes into account main indexes, financial indicators and ratios, indicates predominance of positive trends in their activities in the period from 2016 to 2020. (Table 1).
| Trends and evaluation factors | Share of factor, % |
| Dynamics of average net assets value | |
| Growth (decline) rate in average size of net assets | |
| Increase / decrease in share of enterprises with negative values of net assets | |
| The level of capital concentration (monopolization) | |
| Dynamics of average revenue | |
| Growth (decline) rate in average size of revenue | |
| Dynamics of the average profit (loss) | |
| Rate of growth (decline) in the average size of profit (loss) | |
| Growth / decline in average values of companies’ net profit | |
| Increase / decline in average values of net loss | |
| Increase / decrease in average values of overall liquidity ratio | |
| Increase / decrease in average values of return on investment ratio | |
| Increase / decrease in average values of asset turnover ratio, times | |
| Share of small and medium-sized enterprises in terms of revenue exceeding 20% | |
| Financial position (the largest share) | |
| Globas Solvency Index (the largest share) | |
| Average value of factors share | |
![]() positive trend (factor),
positive trend (factor), ![]() negative trend (factor)
negative trend (factor)