Herald
Business reported for 2020

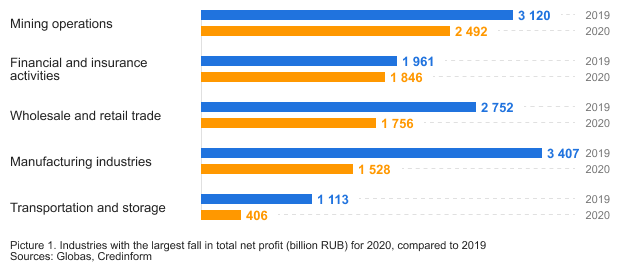
Despite the 5% growth to 255 trillion RUB of total revenue, the 21% decrease in net profit was recorded and amounted to 15 trillion RUB, the largest fall compared to the 2008 results.

Consequences of the economic slowdown

The analysis of financial reports for 2020 revealed that every second company suffered from the economic slowdown: 782 thousand businesses received less net profit than in 2019, and the year-end loss was recorded for over 421 thousand enterprises.

Рисунок  1. Отрасли с наибольшим сокращением совокупной чистой прибыли (млрд. руб.) в 2020 г. в сравнении с 2019 г. Источник: Глобас, Credinform

In the manufacturing sector, the most affected segments are the production of vehicles and chemicals. The spring lockdown, imposed by the Government of the Russian Federation, lead to the decrease in net profit of automotive companies by 710 billion RUB, and this figure is 477 billion RUB for chemical enterprises.

Рисунок 2. Наиболее пострадавшие сегменты отраслей по совокупному финансовому результату (млрд. руб.) в 2020 г., в сравнении с 2019 г. Источник: Глобас, Credinform

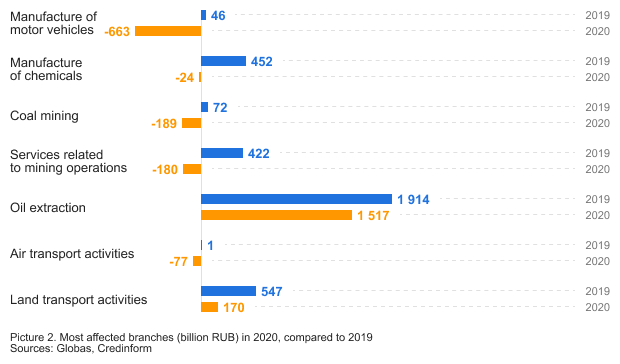
Mining in the Russian Federation is export-oriented, so the industry is directly dependent on external demand. Due to similar restrictions in other countries, the demand for raw materials has decreased, and the volume of production capacity and the net profit of raw materials companies has fallen.

Growth leaders

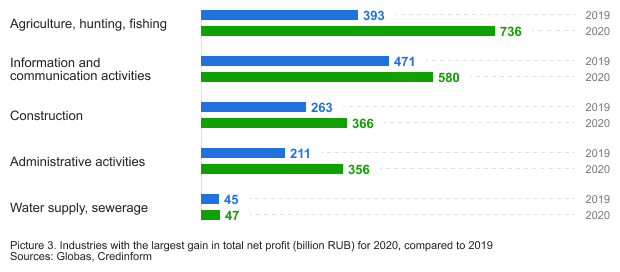
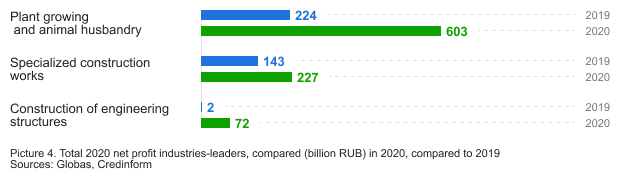
Agriculture and construction are one of the few industries that have shown growth during the recession of the Russian economy. The agro-industrial complex, along with the construction industry, kept working during the restrictions. Now agriculture is an independent, stable industry, and it was proved in spring 2020: with the peak demand for groceries, store shelves have always were full of goods.

Рисунок 3. Отрасли с наибольшим приростом совокупной чистой прибыли (млрд. руб.) в 2020 г. в сравнении с 2019 г. Источник: Глобас, Credinform
Рисунок   4. Сегменты лидеры по совокупной чистой прибыли (млрд. руб.) в 2020 г. в сравнении с 2019 г. Источник: Глобас, Credinform

In conclusion

The fall of the aggregate net profit of most industries, followed by the business limitation in 2020, had a negative impact on the formation of GDP. According to the Ministry of Economic Development and Trade, there was a 3% decrease in the volume of the Russian economy in 2020. Despite the difficult economic situation, the Ministry of Economic Development and Trade has updated the socio-economic forecast for Russia for 2021: GDP is expected to grow by 2.9% due to the stabilization of business and the recovery of consumer demand.

You can learn or update your knowledge on how to analyze the new financial data of your counterparties and to assess their financial situation at the webinar on June 2, 2021.

Article
Trends in manufacture of grocery

Information agency Credinform presents a review of the activity trends of the Russian grocery manufacturers.

The largest manufacturers of grits, flour and pasta, sugar and starch, tea and coffee, chocolate, vegetable oil, salt and spices (TOP-1000) in terms of annual revenue were selected for the analysis according to the data from the Statistical Register and the Federal Tax Service for the latest available accounting periods (2014 – 2020*). The selection of companies and the analysis were based on the data from the Information and Analytical system Globas.

Net assets are total assets less total liabilities. This indicator reflects the real value of the property of an enterprise. When the company’s debt exceeds the value of its property, the indicator is considered negative (insufficiency of property).

The largest TOP-1000 company in term of net assets is LLC MARS, INN 5045016560, Moscow region, engaged in manufacture of chocolate and sugar confectionery. In 2019, net assets value amounted to more than 65 billion RUB.

The lowest net assets value among TOP-1000 was recorded for JSC NEFIS-BIOPRODUCT, INN 1624012256, Republic of Tatarstan, engaged in manufacture of oils and fats, in process of reorganization in the form of acquisition since 17.03.2021. In 2019, insufficiency of property was indicated in negative value of -7 billion RUB.

During five-year period, the average net assets values of TOP-1000 have a trend to increase, with the negative growth rates (Picture 1).

Picture 1. Change in average net assets value in TOP-1000 in 2015 - 2019 Picture 1. Change in average net assets value in TOP-1000 in 2015 - 2019

The shares of TOP-1000 enterprises with insufficient property had negative trend to increase during last 5 years (Picture 2).

Picture 2. Shares of TOP-1000 companies with insufficient property in 2015 - 2019 Picture 2. Shares of TOP-1000 companies with insufficient property in 2015 - 2019

Sales revenue
The revenue volume of the ten leading companies amounted to 39% of the total revenue of TOP-1000 companies in 2019 (Picture 3). It gives evidence to relatively high level of the competition in manufacture of grocery products.

Picture 3. Shares of TOP-10 companies in the total revenue of TOP-1000 in 2019 Picture 3. Shares of TOP-10 companies in the total revenue of TOP-1000 in 2019

In general, there is a trend to decrease in revenue with decreasing growth rates (Picture 4).

Picture 4. Change in average revenue of TOP-1000 in 2015– 2020 Picture 4. Change in average revenue of TOP-1000 in 2015– 2020

Profit and loss
The largest TOP-1000 company in term of net profit is LLC MARS, as well. The company’s profit amounted to 14 billion RUB in 2019.

During six-year period, the average profit figures of TOP-1000 have a trend to decrease with decreasing growth rates (Picture 5).

Picture 5. Change in average profit (loss) of TOP-1000 companies in 2015- 2020 Picture 5. Change in average profit (loss) of TOP-1000 companies in 2015- 2020

During six-year period, the average net profit figures of TOP-1000 companies have a trend to decrease with the decreasing average net loss (Picture 6).

Picture 6. Change in average net profit and net loss of ТОP-1000 companies in 2015 – 2020 Picture 6. Change in average net profit and net loss of ТОP-1000 companies in 2015 – 2020

Key financial ratios
During six-year period, the average values of the current liquidity ratio of TOP-1000 companies were above the recommended one – from 1,0 to 2,0, with a trend to decrease. (Picture 7).

Current liquidity ratio (current assets to short-term liabilities) shows the sufficiency of company’s assets to repay on short-term liabilities.

Picture 7. Change in average values of current liquidity ratio of TOP-1000 in 2015 – 2020 Picture 7. Change in average values of current liquidity ratio of TOP-1000 in 2015 – 2020

During six years, there was a trend to decrease in the average ROI values (Picture 8).

ROI ratio is calculated as net profit to sum of shareholders equity and long-term liabilities, and shows the return of equity involved in commercial activities and long-term borrowed funds.

Picture 8. Change in average values of ROI ratio of TOP-1000 in 2015 – 2020 Picture 8. Change in average values of ROI ratio of TOP-1000 in 2015 – 2020

Assets turnover ratio is the ratio of sales revenue and company’s average total assets for a period. It characterizes the effectiveness of using of all available resources, regardless the source of their attraction. The ratio shows how many times per year the full cycle of production and circulation is performed, generating the corresponding effect in the form of profit.

During the six-year period, there was a trend to decrease of this ratio (Picture 9).

Picture 9. Change in average values of assets turnover ratio of TOP-1000 companies in 2015 – 2020 Picture 9. Change in average values of assets turnover ratio of TOP-1000 companies in 2015 – 2020

Small enterprises
75% companies of TOP-1000 are registered in the Register of small and medium-sized enterprises of the Federal Tax Service of the Russian Federation. However, their share in total revenue of TOP-1000 in 2019 amounted 11,3%, which is almost twice lower than the average country values in 2018 - 2019 (Picture 10).

Picture 10. Shares of small and medium-sized enterprises in TOP-1000 Picture 10. Shares of small and medium-sized enterprises in TOP-1000

Main regions of activity
Companies of TOP-1000 are registered in 71 regions of Russia, and unequally located across the country. More than 32% of the TOP-1000 companies’ total revenue consolidate in Moscow and Moscow region (Picture 11).

Picture 11. Distribution of TOP-1000 revenue by the regions of Russia Picture 11. Distribution of TOP-1000 revenue by the regions of Russia

Financial position score
According to the assessment, the financial position of most of TOP-1000 companies is above average (Picture 12).

Picture 12. Distribution of TOP-1000 companies by financial position score Picture 12. Distribution of TOP-1000 companies by financial position score

Solvency index Globas
Most of TOP-1000 companies got Superior / High and Strong / Medium index Globas. This fact shows their ability to meet their obligations fully and by the due date (Picture 13).

Picture 13. Distribution of TOP-1000 companies by solvency index Globas Picture 13. Distribution of TOP-1000 companies by solvency index Globas

Conclusion
Complex assessment of activity of the grocery manufacturers, taking into account the main indexes, financial ratios and indicators, demonstrates the prevalence of negative trends in their activity in 2015- 2020 (Table 1).

Table 1. Positive and negative trends, evaluation factors
Trends and evaluation factors Relative share of factors, %
Dynamics of the average net assets value up10
Rate of growth (decline) in the average size of net assets down-10
Increase / decrease in the share of enterprises with negative values of net assets down-10
Level of capital concentration up10
Dynamics of the average revenue down-10
Rate of growth (decline) in the average size of revenue down-10
Dynamics of the average profit (loss) down-10
Rate of growth (decline) in the average size of profit (loss) down-10
Growth / decline in average values of net profit down-10
Growth / decline in average values of net loss up10
Increase / decrease in average values of current liquidity ratio down-5
Increase / decrease in average values of return on investment ratio down-10
Increase / decrease in average values of asset turnover ratio, times down-10
Share of small and medium-sized businesses in terms of revenue in the region being more than 20% down-10
Regional concentration down-5
Financial position (the largest share) up10
Solvency index Globas (the largest share) up10
Average value of relative share of factors up-3,8

вверх positive trend (factor), вниз negative trend (factor)


<p >(*) – data for 2020 is given on companies, which reported the financial accounts to the FTS in March 2021.