
Order a report
Custom-made industry research, company ratings, competitor analysis


Net profit ratio of the largest Russian furniture manufacturers
Information agency Credinform has prepared a ranking of the largest Russian furniture manufacturers. Furniture manufacturers with the largest annual revenue (TOP-10) were selected for the ranking, according to the data from the Statistical Register for the latest available accounting periods (2015 - 2017). Then they were ranked by revenue (Table 1). The analysis was based on the data from the Information and Analytical system Globas.
Sales revenue is money or tangible assets in monetary terms received as a result of business activity after sale of goods and services. Net profit ratio is calculated as a relation of net profit (loss) to sales revenue.
Revenue and the ratio demonstrate the company’s scale and efficiency of its business activity. As a rule, the larger the revenue, the stronger its resistance to negative factors that could be ruinous for small and microenterprises. Revenue also reflects production capacity of a company, especially if taken over time. A real assessment of the company’s market competitiveness can be made by adding net profit ratio to the analysis. A high net profit ratio (higher than the average industry one) indicates a more favorable company’s position in relation to its competitors.
In general, the analysis of furniture production sector shows that this market is rather low concentrated, in other words, there is a large number of participants: 42,2% of total revenue is accounted for by TOP-50 companies, and 86,2% - by TOP-1000. In addition, both in 2016 and 2017 almost half of companies of the sector had a net profit ratio higher than the average industry value. This indicates that this market comprises mostly small and medium-sized companies, and that entry barriers are not high.
A combination of both indicators and their change over time is to be taken into account to get a full and fair view of financial standing of the companies of the sector. See the ranking of TOP-10 companies below (Table 1).
| Name, INN, region | Sales revenue, million RUB | Net profit (loss), million RUB | Net profit ratio, % | Solvency index Globas | |||
| 2016 | 2017 | 2016 | 2017 | 2016 | 2017 | ||
| 1 | 2 | 3 | 4 | 5 | 6 | 7 | 8 |
| MEBEL STYLE LLC INN 3907046732 |
|
|
|
|
|
|
275 Medium |
| ASKONA-VEK LLC INN 3305037917 |
|
|
|
|
|
|
227 Strong |
| Furniture factory Marya LLC INN 6455026772 |
|
|
|
|
|
|
200 Strong |
| KING OF SOFAS LLC INN 6432009756 |
|
|
|
|
|
|
296 Medium |
| DOK-15 LLC INN 5050079140 |
|
|
|
|
|
|
222 Strong |
| OZ MICRON JSC INN 6002005478 |
|
|
|
|
|
|
175 High |
| JOINT STOCK FURNITURE COMPANY SHATURA INN 5049007736 |
|
|
|
|
|
|
210 Strong |
| IKEA INDUSTRY TIKHVIN LLC INN 4715011103 |
|
|
|
|
|
|
251 Medium |
| MZ5 GROUP LLC INN 4312146860 |
|
|
|
|
|
|
290 Medium |
| LTD ALIVE SOFAS INN 5029042443 |
|
|
|
|
|
|
213 Strong |
| Total for TOP-10 companies | 48686 | 51836 | 1651 | 1349 | |||
| Average for TOP-10 companies | 4869 | 5184 | 165 | 135 | 2,88 | 2,81 | |
| Average industry value | 26,1 | 28,8 | 0,7 | 0,7 | 2,77 | 2,37 | |
![]() — improvement compared to prior period,
— improvement compared to prior period, ![]() — decline compared to prior period.
— decline compared to prior period.
In 2017, seven of TOP-10 companies improved their revenue, and also seven companies advanced their efficiency and improved net profit ratio. Along with this, average sales revenue of TOP-10 grew, and average value of net profit declined slightly.
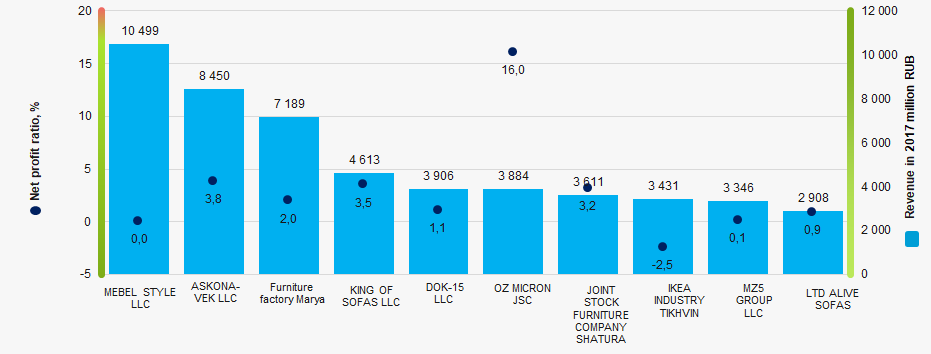 Picture 1. Net profit ratio and revenue of the largest Russian furniture manufacturers (TOP-10)
45,47% of total industry revenue in 2017 was produced by companies of the Central federal district (Picture 2). Moscow and the Moscow region have 15,37 and 14,1% of total revenue respectively, and St. Petersburg - 5,94%. In addition, 10,6% of companies’ legal addresses are in Moscow, 8,5% - in St. Petersburg, and 8% - in the Moscow region. This indicates that to some extent furniture production is concentrated in the Central federal district, and federal cities (Moscow and St. Petersburg) play an important role within the industry.
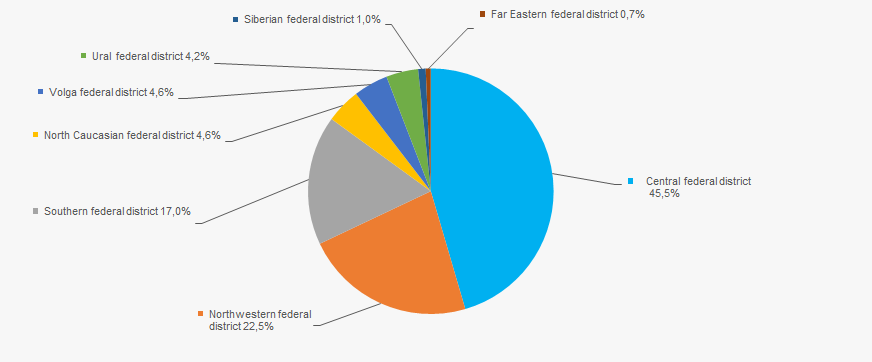 Picture 2. Regions by their share in total revenue of 2017
During the decade, average industry value of net profit ratio have been rather stable, excluding crisis years with small decrease (Picture 3). In general, the industry has coped the recession of 2013-2015 and has come to a stable level of the ratio.
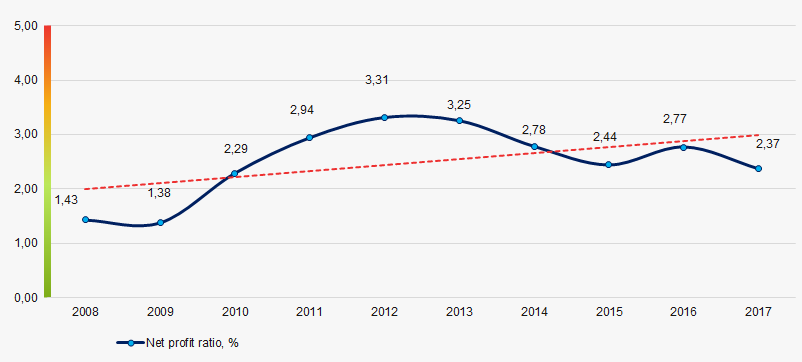 Picture 3. Change in average industry value of net profit ratio in 2008 – 2017