
Order a report
Custom-made industry research, company ratings, competitor analysis


TOP-10 builders of engineering constructions
Information agency Credinform presents a ranking of the Russian builders of engineering constructions. Industry players (TOP-10) with the largest annual revenue were selected for the ranking, according to the data from the Statistical Register and the Federal Tax Service for the latest available accounting periods (2018 - 2019). Then the enterprises were ranked by the return on costs ratio (Table 1). The analysis was based on the data from the Information and Analytical system Globas.
Return on costs (%) is calculated as the relation of profit before taxation to the sum of costs for production and sale of products and reflects the amount of income from one spent ruble.
In order to get the most comprehensive and fair picture of the financial standing of an enterprise, it is necessary to pay attention to all combination of financial indicators and ratios.
| Name, INN, region | Revenue, million RUB | Net profit (loss), million RUB | Return on costs, % | Solvency index Globas | |||
| 2018 | 2019 | 2018 | 2019 | 2018 | 2019 | ||
| 1 | 2 | 3 | 4 | 5 | 6 | 7 | 8 |
| RENAISSANCE HEAVY INDUSTRIES LLC INN 7802772445 Moscow |
|
|
|
|
|
|
245 Strong |
| AO VAD INN 7802059185 Vologda region |
|
|
|
|
|
|
180 High |
| OOO OSK 1520 INN 7701753020 Moscow |
|
|
|
|
|
|
185 High |
| CJSC STROYTRANSNEFTEGAZ INN 7714572888 St. Petersburg |
|
|
|
|
|
|
236 Strong |
| AO DSK AVTOBAN INN 7725104641 Moscow |
|
|
|
|
|
|
207 Strong |
| JSC MOSTOTREST INN 7701045732 Moscow |
|
|
|
|
|
|
235 Strong |
| JSC STROYGAZMONTAZH INN 9729299794 Moscow |
|
|
|
|
|
|
283 Medium |
| JSC CONCERN TITAN-2 INN 7827004484 Moscow |
|
|
|
|
|
|
206 Strong |
| LLC GAZPROM INVEST INN 7810483334 St. Petersburg |
|
|
|
|
|
|
309 Adequate |
| JSC LENGAZSPETSSTROY INN 7806027191 St. Petersburg |
|
|
|
|
|
|
290 Medium |
| Average value for TOP-10 | |
|
|
|
|
|
|
| Average industry value | |
|
|
|
|
|
|
![]() improvement compared to prior period,
improvement compared to prior period, ![]() decline compared to prior period
decline compared to prior period
Average value of return on costs ratio of TOP-10 is higher than the average industry value. Just one company has improved its values in 2019 comparing to the previous period.
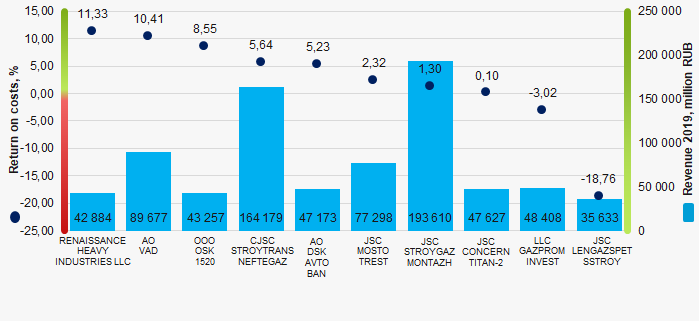 Picture 1. Return on costs ratio and revenue of the largest builders of engineering constructions in Russia (TOP-10)
During 4 years, the average industry values of the return on costs ratio had a trend to decrease (Picture 2).
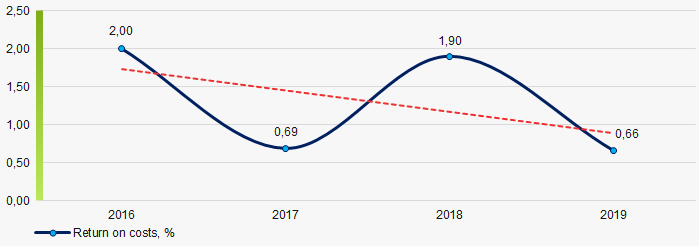 Picture 2. Change in the average values of the return on costs ratio of the largest builders of engineering constructions in Russia in 2016 - 2019