Verified counterparty is better than litigations
Institute of Bankruptcy loses its effectiveness
The current bankruptcy law has turned out to be untenable. The statistics of asset recovery through court action is constantly decreasing, the measures for financial rehabilitation do not work. The only effective way to protect assets is to check business partners in advance and monitor constantly.
Less bankruptcies, more outstanding claims. According to the Information and Analytical system Globas-i® of the Information agency «Credinform», the court's decisions to start a bankruptcy proceeding were made against 15 000 legal entities in 2016 (in 2015 – against 18 600). A little more than 3 500 of such decisions were made for the 1st quarter of 2017. However, despite the decline in the number of bankruptcies, the statistics of debt collection in insolvency cases is also decreasing. According to the Unified Federal Register of Bankruptcy Information, the total share of cancelled claims of creditors (except bankruptcy cases of banks) to debtors – legal entities and individual entrepreneurs was only 3,2% (19,5 billion rubles from the declared 610 billion rubles) in 2016 and decreased by more than 2% in comparison with 2015 (then 5,4% of claims were cancelled: 25,5 billion rubles from 472,5 billion rubles). Experts agree: the effectiveness of the bankruptcy procedure fall constantly, to recover assets becomes more difficult, while the solvency restoration instrument also does not work.
Ineffective bankruptcy. There are several reasons for such bad statistics. Firstly, it is a lack of assets by debtors. The practice of doing business in Russia today is such that often only the necessary minimum of assets is concentrated on each business entity, which before the beginning of the bankruptcy procedure can be quickly replaced with an illiquid or just withdrawn, and creditors hardly will be able to count on anything. However, even an available property is often not easy to dispose, therefore the auctions are delayed, and the final reduction of price can reach 70%. Secondly, the monitoring procedure, being intended to rehabilitate the debtor's solvency, turns out to be also ineffective: it can drag on for more than a year, this time will be enough for unfair bankrupts to withdraw assets and destroy documentation. At the same time, too long procedure of monitoring prevents timely transition to recovery. Thirdly, the low level of professionalism of insolvency officers prevents the effectiveness of the bankruptcy procedure. And, finally, an important problem is the unappealable statutory right of creditors to decide the debtor's fate, that discourages him to keep his assets, that is why he goes for to withdraw them by any means.
Protection of assets is in the timely verification of business partners. First of all, the correction of the legislation is required to change the situation for the better. Currently, amendments to the bankruptcy law proposed by the Ministry of Economy are being approved. It is important to pay attention to improving the quality of work of insolvency officers. However, for radical improvement of the situation it is necessary to change the perception of the bankruptcy institute by the business community. And for this the general economic situation in the country should change, when the laws steady and effectively work over the decades, and the market operates under transparent and uniform rules for all participants. It will take a significant amount of time, meanwhile experts are solidarity in one point: for safe business it is necessary to take care of the reliability and solvency of business partners in advance, not relying on the possibility of debt collection through court action, including also during the bankruptcy procedure. Timely verification of new counterparties and permanent monitoring of existing ones will save the business from losses much more efficiently than any legal proceeding. An effective method of preventing risks of cooperation with unreliable business partners is the use of the Information and Analytical system Globas-i® , containing information about legal entities and individual entrepreneurs around the world, but, that is more important, has a wide range of analytical instruments, which allow to solve the problem of minimizing the risks of business cooperation rapid and effective.
Profitability of sales of the largest Russian retailers of household appliances
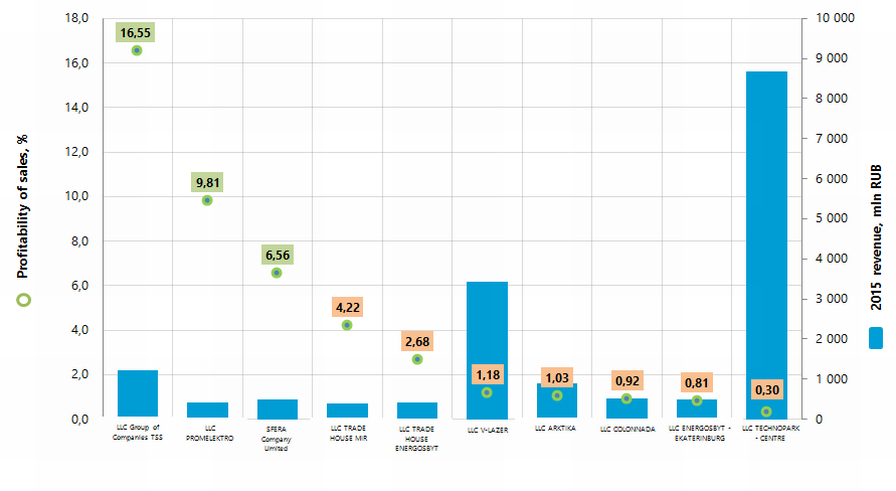
Information Agency Credinform has prepared the ranking of the largest Russian retailers of household appliances. The largest enterprises (TOP-10 and TOP-100) in terms of annual revenue were selected according to the data from the Statistical Register for the latest available periods (2015 and 2014). Then the companies were ranged by 2015 profitability of sales ratio (Table 1).
Profitability of sales (%) is the share of operating profit in the sales volume of the company. The ratio characterizes the efficiency of the industrial and commercial activity and shows the company’s funds, which remained, after covering the cost of production, interest and tax payments.
Profitability of sales ratio characterizes the efficiency of price policy and shows the ability of company's management to control the expenses. Differences in competitive strategies and product lines cause a substantial range of ratio values within companies of the same industry. Therefore it should be taken into account, that at equal values of revenue, operational expenses and profit before tax, the profitability of sales ratio of two companies can be significantly different, due to the influence of interest payments on net profit.
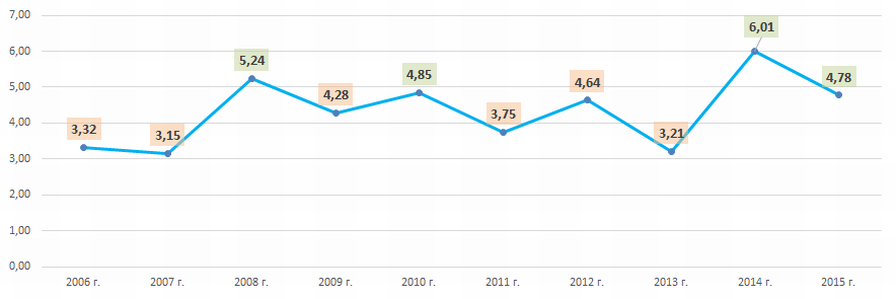
The calculation of practical values of financial indicators, which might be considered as normal for a certain industry, has been developed and implemented in the Information and Analytical system Globas-i®, by the experts of Information Agency Credinform, taking into account the actual situation of the economy as a whole and the industries. The practical value of profitability of sales ratio for retailers of household appliances starts from 4,78%.
For the most full and fair opinion about the company’s financial position, the whole set of financial indicators and ratios of the company should be taken into account.
| Name, INN, region | 2015 net profit, mln RUB | 2015 revenue, mln RUB | 2015/2014 revenue,% | Profitability of sales, % | Solvency index Globas-i® |
| LLC Group of Companies TSSINN 7702325027 Moscow | 170,5 | 1 227,8 | 35,6 | 16,55 | 164 The highest |
| LLC PROMELEKTRO INN 6122017764 Rostov region | 36,1 | 406,2 | 63,7 | 9,81 | 220 High |
| SFERA Company Limited INN 7811318767 Saint-Petersburg | 24,2 | 479,3 | -1,0 | 6,56 | 239 High |
| LLC TRADE HOUSE MIR INN 0541028003 Republic of Dagestan | 13,5 | 388,4 | 16,2 | 4,22 | 190 The highest |
| LLC TRADE HOUSE ENERGOSBYT INN 7813182222 Saint-Petersburg | 1,4 | 420,2 | 54,4 | 2,68 | 211 High |
| LLC V-LAZER INN 2540137652 Primorsky Krai | 20,7 | 3 424,5 | -27,5 | 1,18 | 265 High |
| LLC ARKTIKA INN 1501009790 Republic of North Ossetia-Alani | 11,6 | 889,4 | -19,0 | 1,03 | 232 High |
| LLC COLONNADA INN 6367659470 Samara region | 0,8 | 520,5 | -8,3 | 0,92 | 208 High |
| LLC ENERGOSBYT - EKATERINBURG INN 6674134266 Sverdlovsk region | 1,2 | 484,3 | -12,2 | 0,81 | 272 High |
| LLC TECHNOPARK - CENTRE INN 7715631511 Moscow | 97,8 | 8 664,6 | -6,9 | 0,30 | 239 High |
| Total for TOP-10 group of companies | 377,8 | 16 905,2 | |||
| Total for TOP-100 group of companies | 740,9 | 26 604,8 | |||
| Average value within TOP-10 group of companies | 37,8 | 1 690,5 | 8,5 | 4,41 | |
| Average value within TOP-100 group of companies | 7,4 | 266,0 | -5,2 | 6,28 | |
| Industry average value | 1,1 | 61,3 | -23,9 | 4,78 |
In 2015 the average value of profitability of sales ratio in TOP-10 group of companies is lower than practical value and in TOP-100 group of companies – it is higher (green and yellow colors respectively in Table 1 and Picture 1).
 Picture 1. Profitability of sales ratio and revenue of the largest Russian retailers of household appliances (TOP-10)
In 2015 total revenue of 10 largest companies amounted to 64% from TOP-100 total revenue. This fact testifies rather high level of monopolization within industry. Thus, total revenue of the largest company within industry LLC TECHNOPARK - CENTRE amounted to 33% from TOP-100 total revenue (Picture 2).
 Picture 2. The shares of TOP-10 companies in TOP-100 total revenue for 2015, %
All companies from TOP-10 list have the highest or high solvency index Globas-i® this fact shows the ability of the companies to meet their obligations in time and fully.
In 2015 seven companies from TOP-10 have decrease in revenue or net profit in comparison with previous period (red color in Table 1).
In 2014 the TOP-100 list included 9 loss-making companies and in 2015 their number increased to 11. Meanwhile, their average loss increased more than twice. The average profit of other companies from TOP-100 list increased by almost 18% for the same period (Picture 3).
 Picture 3. The number of loss-making companies and their average loss, average profit within TOP-100 group of companies in 2014 – 2015.
In 2015 seven companies from TOP-10 have decrease in revenue or net profit in comparison with previous period (red color in Table 1).
In general, the industry ratios of profitability of sales were within practical values in 2008, 2010, 2014 and 2015 (Picture 4), this indicates about relatively high level of activity efficiency of companies’ in the industry.
 Picture 4. The industry average values of profitability of sales of the largest Russian household appliances retailers in 2006-2015
 In general, the industry ratios in monetary terms reflect macroeconomic trends; this testifies the data from the Federal State Statistics Service (Picture 5 and Table 2).
 Picture 5. The growth (decline) rate of retail trade of electrical household appliances in monetary terms, from year to year, %
For the last 10 years the greatest volume of retail trade of electrical household appliances was observed in 2016 (Table 2).
| Retail trade: | 2007 | 2008 | 2009 | 2010 | 2011 | 2012 | 2013 | 2014 | 2015 | 2016 |
| household appliances, radio and television goods | 134,8 | 163,7 | 132,0 | 225,8 | 295,5 | 379,9 | 467,9 | 393,3 | 411,6 | 548,6 |
| computers, software and peripheral devices ** | 15,7 | 13,2 | 14,1 | 20,3 | 31,2 | 46,3 | 37,1 | 42,4 | 54,5 | 78,0 |
| through television, radio, phone and Internet** | 1,0 | 2,1 | 2,5 | 3,3 | 4,7 | 7,3 | 21,9 | 22,3 | 19,1 | 57,9 |
*) in Table 2: red color - decline in trade volumes, green color - growth in trade volumes
**) data for reference
Retailers of household appliances are rather equally distributed across the country. The maximum concentration is observed in the regions with the largest and solvent population. This fact is confirmed by data from the Information and Analytical system Globas-i® according to which 100 largest companies in terms of 2015 revenue are registered in 40 Russian regions (Picture 5).
 Picture 6. Distribution across the country of 100 largest Russian largest Russian retailers of household appliances