
Order a report
Custom-made industry research, company ratings, competitor analysis


Solvency ratio of the largest Russian coal mining companies
Information agency Credinform prepared a ranking of the largest Russian coal mining companies. The coal mining enterprises with the highest volume of revenue (TOP-10 and TOP-100) were selected for the ranking, according to the data from the Statistical Register for the latest available accounting periods (2015 and 2014). Then the companies were ranked by decrease in solvency ratio in 2015 (Table 1).
Solvency ratio (х) is calculated as a relation of equity capital to total assets and characterizes the company's dependence on external loans. Recommended value of the ratio is > 0,5.
The ratio value below the minimum recommended limit means a high dependence on external sources of financing. By the worsening of conjecture in the market it may lead to liquidity crisis and to unstable financial position.
Taking into account the actual situation both for the economy in general and in industries, experts of the Information agency Credinform developed and realized in the Information and analytical system Глобас-i® of actual values of financial ratios that can be normal for the particular industry. For coal mining companies actual value of the solvency ratio is from -0,22 to 0,58.
For getting of the most comprehensive and fair picture of the financial standing of an enterprise it is necessary to pay attention to all available combination of ratios, financial and other indicators.
| Name, INN, region | Net profit (loss) of 2015, mln RUB | Revenue of 2015, mln RUB | Revenue of 2015 to 2014, +/- % | Solvency ratio, (х) >0,5 | Solvency index Globas-i® |
| JSC SIBERIAN ANTHRACITE INN 5406192366 Novosibirsk region | 6 194,9 | 22 036,9 | 17 | 0,48 | 225 Hight |
| JSC VORKUTAUGOL INN 1103019252 The Komi Republic | 1 819,9 | 29 624,6 | 51 | 0,46 | 281 Hight |
| JSC KUZBASSKAYA TOPLIVNAYA COMPANY INN 4205003440 Kemerovo region | 1 032,3 | 20 624,7 | 9 | 0,45 | 217 Hight |
| JSC COAL COMPANY KUZBASSRAZREZUGOL INN 4205049090 Kemerovo region | 3 683,4 | 73 496,6 | 27 | 0,38 | 243 Hight |
| LLC SUEK-KHAKASIA INN 1903017342 The Republic of Khakassia | 1 552,0 | 20 375,0 | 22 | 0,14 | 268 Hight |
| JSC RAZREZ TUGNUISKII INN 0314002305 The Republic of Buryatia | 665,0 | 23 231,0 | 6 | 0,06 | 256 Hight |
| JSC CHERNIGOVETS INN 4203001913 Kemerovo region | -3 872,6 | 23 919,8 | 29 | -0,12 | 311 Satisfactory |
| JSC SUEK-KUZBASS INN 4212024138 Kemerovo region | -11 125,0 | 72 194,0 | 5 | -0,17 | 299 Hight |
| OJSHC YAKUTUGOL INN 1434026980 The Sakha (Yakutia) Republic | -18 470,0 | 28 549,3 | 52 | -0,38 | 350 Satisfactory |
| JSC SUEK-KRASNOYARSK INN 2466152267 Krasnoyarsk territory | 1 132,0 | 19 484,0 | 17 | -0,97 | 291 Hight |
| Total for TOP-10 group | -17 388,0 | 333 535,8 | |||
| Total for TOP-100 group | -44 881,6 | 638 941,2 | |||
| Average TOP-10 value | -1 738,8 | 33 353,6 | 19 | 0,03 | |
| Average TOP-100 value | -448,8 | 6 389,4 | 28 | 0,01 | |
| Average value for the industry | -165,3 | 1 465,2 | 15 | 0,03 |
The average values of the solvency ratio in 2015 in the group of TOP-10 and TOP-100 largest coal mining enterprises are below recommended and are in the interval of actual values (marked with red and yellow filling in Table 1 and Picture 1, correspondingly). Besides, OJSHC YAKUTUGOL and JSC SUEK-KRASNOYARSK have got negative solvency index that are not included in the interval of actual values.
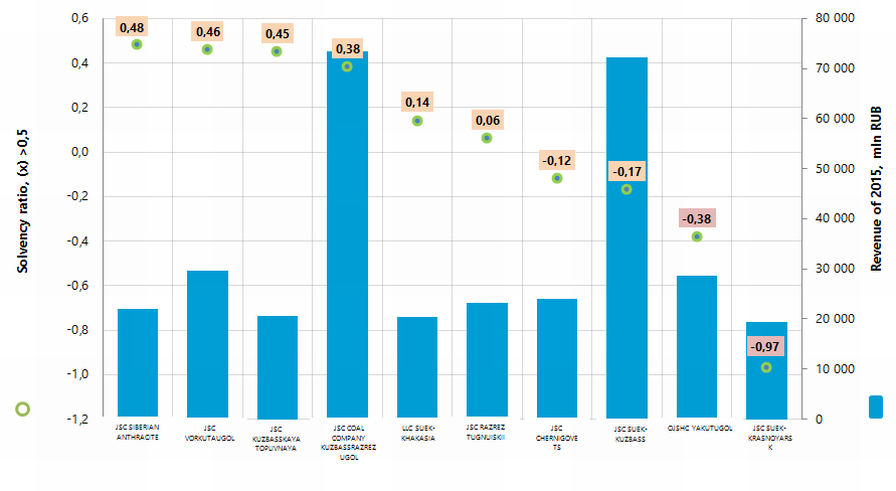 Picture 1. Solvency ratio and revenue of the largest Russian coal mining companies (TOP-10)
Revenue volume of the TOP-10 companies in 2015 was 52% of the total revenue of the TOP-100 companies. It shows relatively high level of monopolization in the industry. For example, revenue volume of the three largest companies is 28% of the total revenue of the 100 largest companies (Picture 2).
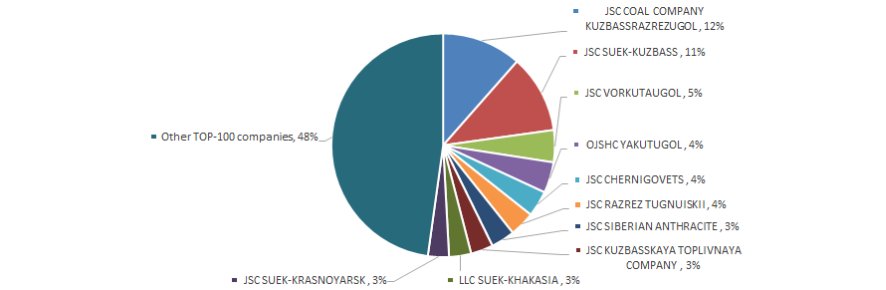 Picture 2. Shares of the TOP-10 companies in revenue of 2015 of the TOP-100 group, %
60% companies out of TOP-100 made open-pit coal mining (Picture 3.)
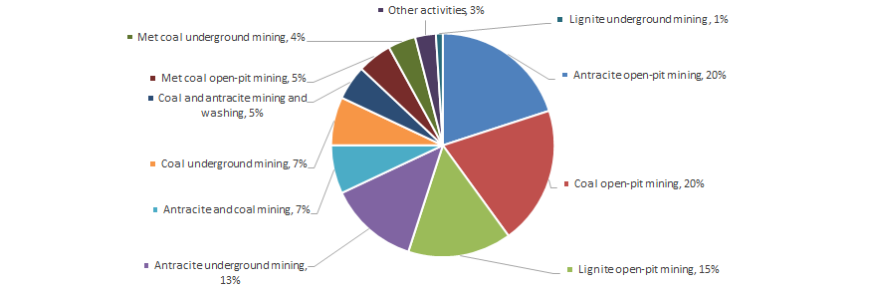 Picture 3. Distribution of the TOP-100 coal mining companies in terms of types of activity, %
Eight out of TOP-10 companies have got high solvency index Globas-i® , that indicates their ability to repay their debts in time and fully.
JSC CHERNIGOVETS has got satisfactory solvency index Globas-i® , because of the information about the participation as a defendant in arbitration court proceedings in terms of debt collection, cases of late performance of obligations and loss in the balance sheets. Projected growth of the index is stable.
OJSHC YAKUTUGOL has got satisfactory solvency index Globas-i®, because of the information about claim for recognition of the company bankrupt. Results of proceedings should be expected. Moreover, there are cases of late performance of obligations, unclosed enforcement orders. The company has loss in the balance sheets. Projected growth of the index is negative.
All TOP-10 companies increased revenue indicators in 2015 against the previous period, besides, four companies decreased profit indicators and have got loss (marked with red filling in Table 1).
In the TOP-100 group in 2014 59 loss-making companies were observed, in 2015 their amount decreased up to 45. Besides, the loss value 15% increased (Picture 4).
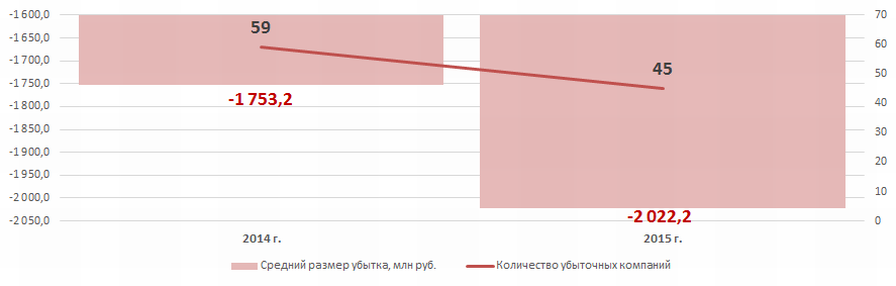 Picture 4. Amount of loss-making companies and average loss (mln RUB) in the TOP-100 companies in 2014 – 2015.
In general, industrial solvency ratios stayed only within actual values in 2006 - 2015 (Picture 5), that shows relatively high dependence of the companies on external financial sources.
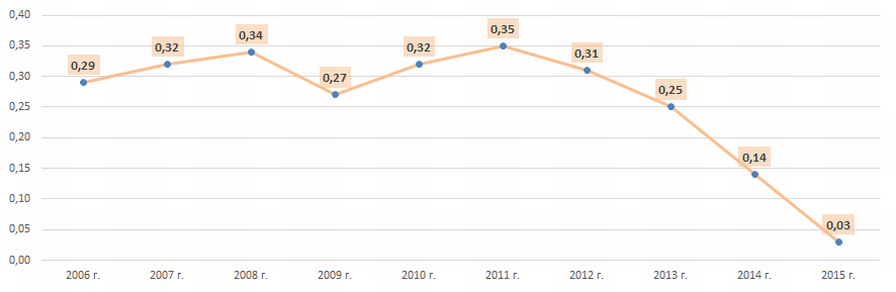 Picture 5. Average industrial values of solvency ratio of the Russian coal mining companies in 2006 – 2015
 Indicators of the coal mining industry in natural terms demonstrate positive dynamics in general, that is confirmed by the data from the Federal State Statistics Service (Picture 6 and Table 2).
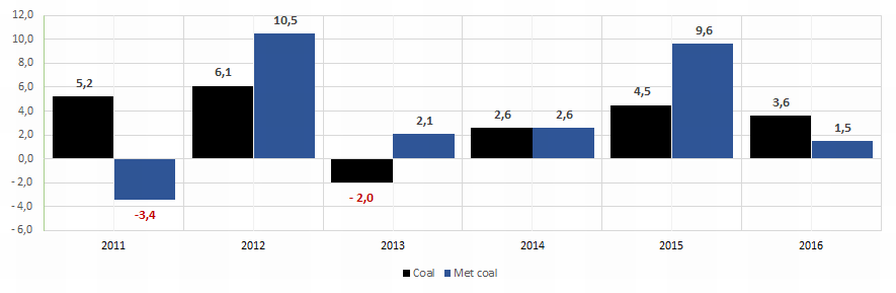 Picture 6. Growth rate of coal mining volume in natural terms, year-on-year, %.
In the period from 2010 to 2016 the largest coal mining volume was observed in 2016. (Table 2).
| 2010 | 2011 | 2012 | 2013 | 2014 | 2015 | 2016 | |
| Coal | 317,0 | 333,8 | 354,3 | 347,2 | 356,1 | 372,0 | 385,4 |
| Met Coal | 67,1 | 64,8 | 71,6 | 73,1 | 75,0 | 82,2 | 83,4 |
Coal mining companies are distributed on the territory of the country irregularly. Their maximum concentration is observed in regions disposing natural coal reserves, that is especially typical for Kemerovo region. That is confirmed by the data from the Information and analytical system Глобас-i®, according to that the 100 largest companies in terms of revenue volume for 2015 are registered in 20 regions of Russia (Picture 7).
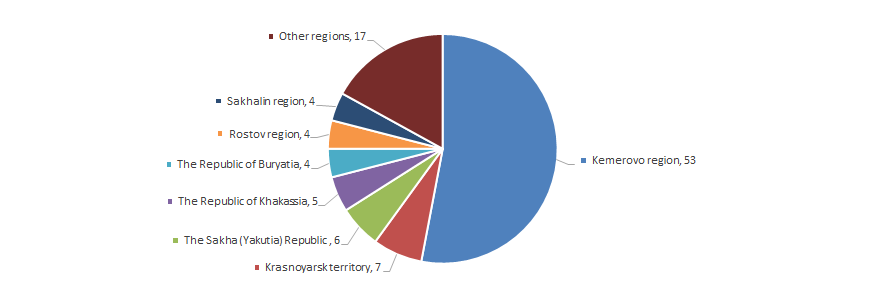 Picture 7. Distribution of the 100 largest coal mining companies through regions of Russia